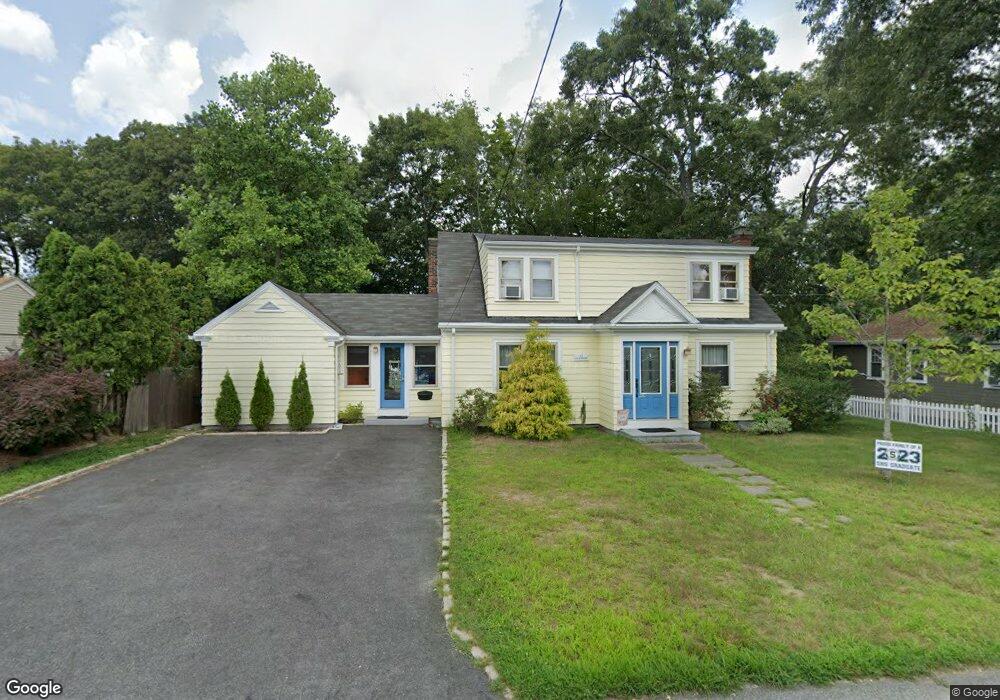
53 Gleason St Cranston, RI 02910
Spectacle NeighborhoodEstimated Value: $437,000 - $507,000
4
Beds
2
Baths
1,725
Sq Ft
$266/Sq Ft
Est. Value
About This Home
This home is located at 53 Gleason St, Cranston, RI 02910 and is currently estimated at $458,556, approximately $265 per square foot. 53 Gleason St is a home located in Providence County with nearby schools including Stadium Elementary School, Hugh B. Bain Middle School, and Cranston High School East.
Ownership History
Date
Name
Owned For
Owner Type
Purchase Details
Closed on
Dec 10, 2021
Sold by
Goffe Terry L and Goffe Shannon
Bought by
Goffe Shannon
Current Estimated Value
Purchase Details
Closed on
Jul 30, 2004
Sold by
Saunders Alexa and Roy Joseph
Bought by
Goffe 2Nd Terry and Goffe Shannon
Home Financials for this Owner
Home Financials are based on the most recent Mortgage that was taken out on this home.
Original Mortgage
$239,900
Interest Rate
6.33%
Mortgage Type
Purchase Money Mortgage
Purchase Details
Closed on
Sep 1, 1999
Sold by
Mcgabe Gertrude J Est
Bought by
Saunders Alexa
Create a Home Valuation Report for This Property
The Home Valuation Report is an in-depth analysis detailing your home's value as well as a comparison with similar homes in the area
Home Values in the Area
Average Home Value in this Area
Purchase History
| Date | Buyer | Sale Price | Title Company |
|---|---|---|---|
| Goffe Shannon | -- | None Available | |
| Goffe 2Nd Terry | $300,000 | -- | |
| Saunders Alexa | $110,000 | -- |
Source: Public Records
Mortgage History
| Date | Status | Borrower | Loan Amount |
|---|---|---|---|
| Previous Owner | Saunders Alexa | $239,900 | |
| Previous Owner | Saunders Alexa | $140,577 | |
| Previous Owner | Saunders Alexa | $15,300 | |
| Previous Owner | Saunders Alexa | $112,000 |
Source: Public Records
Tax History Compared to Growth
Tax History
| Year | Tax Paid | Tax Assessment Tax Assessment Total Assessment is a certain percentage of the fair market value that is determined by local assessors to be the total taxable value of land and additions on the property. | Land | Improvement |
|---|---|---|---|---|
| 2025 | $4,753 | $342,400 | $102,000 | $240,400 |
| 2024 | $4,660 | $342,400 | $102,000 | $240,400 |
| 2023 | $4,542 | $240,300 | $70,400 | $169,900 |
| 2022 | $4,448 | $240,300 | $70,400 | $169,900 |
| 2021 | $4,325 | $240,300 | $70,400 | $169,900 |
| 2020 | $3,917 | $188,600 | $66,800 | $121,800 |
| 2019 | $3,917 | $188,600 | $66,800 | $121,800 |
| 2018 | $3,827 | $188,600 | $66,800 | $121,800 |
| 2017 | $3,177 | $138,500 | $49,300 | $89,200 |
| 2016 | $3,109 | $138,500 | $49,300 | $89,200 |
Source: Public Records
Map
Nearby Homes