Estimated Value: $1,184,000 - $1,496,000
3
Beds
5
Baths
2,281
Sq Ft
$593/Sq Ft
Est. Value
About This Home
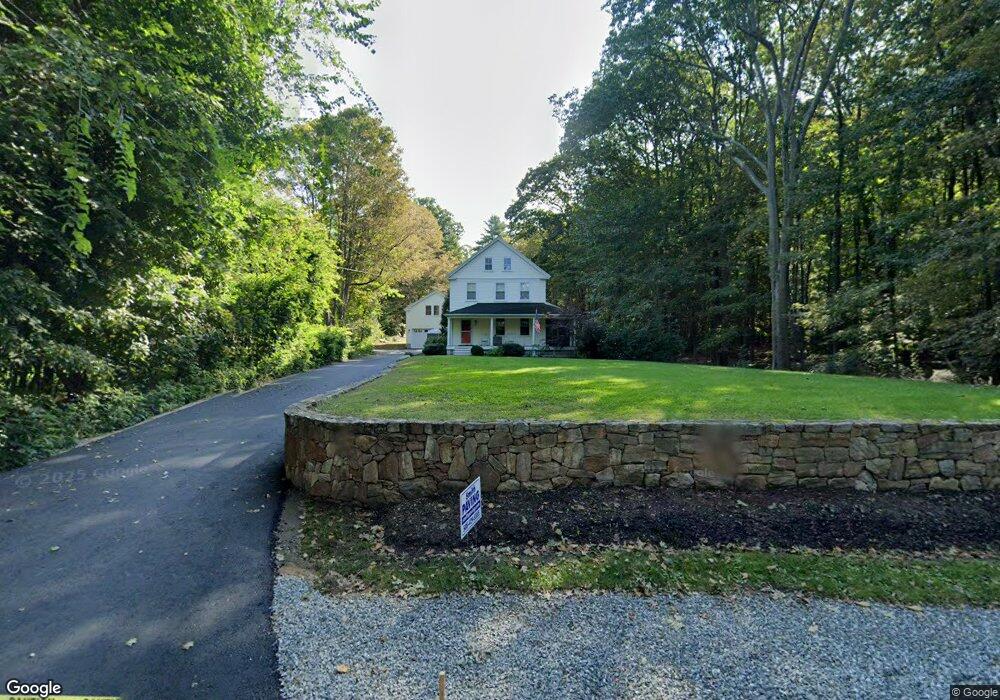
This home is located at 53 Glen St, Dover, MA 02030 and is currently estimated at $1,351,790, approximately $592 per square foot. 53 Glen St is a home located in Norfolk County with nearby schools including Chickering Elementary School, Dover-Sherborn Regional Middle School, and Dover-Sherborn Regional High School.
Ownership History
Date
Name
Owned For
Owner Type
Purchase Details
Closed on
Jun 22, 2006
Sold by
Laird Inta A and Laird Peter D
Bought by
Laird Jane B and Laird Peter D
Current Estimated Value
Home Financials for this Owner
Home Financials are based on the most recent Mortgage that was taken out on this home.
Original Mortgage
$650,000
Interest Rate
6.59%
Mortgage Type
Purchase Money Mortgage
Purchase Details
Closed on
Jun 14, 2005
Sold by
Tuttle Kris
Bought by
Laird Inta A and Laird Peter D
Purchase Details
Closed on
Dec 19, 2003
Sold by
Brown Dorothy C
Bought by
Tuttle Kris
Home Financials for this Owner
Home Financials are based on the most recent Mortgage that was taken out on this home.
Original Mortgage
$300,000
Interest Rate
5.96%
Mortgage Type
Purchase Money Mortgage
Create a Home Valuation Report for This Property
The Home Valuation Report is an in-depth analysis detailing your home's value as well as a comparison with similar homes in the area
Home Values in the Area
Average Home Value in this Area
Purchase History
| Date | Buyer | Sale Price | Title Company |
|---|---|---|---|
| Laird Jane B | $850,000 | -- | |
| Laird Inta A | $595,000 | -- | |
| Tuttle Kris | $625,000 | -- |
Source: Public Records
Mortgage History
| Date | Status | Borrower | Loan Amount |
|---|---|---|---|
| Open | Tuttle Kris | $650,000 | |
| Closed | Laird Jane B | $650,000 | |
| Previous Owner | Tuttle Kris | $300,000 |
Source: Public Records
Tax History
| Year | Tax Paid | Tax Assessment Tax Assessment Total Assessment is a certain percentage of the fair market value that is determined by local assessors to be the total taxable value of land and additions on the property. | Land | Improvement |
|---|---|---|---|---|
| 2025 | $14,089 | $1,250,100 | $656,300 | $593,800 |
| 2024 | $13,202 | $1,204,600 | $634,500 | $570,100 |
| 2023 | $12,056 | $989,000 | $557,100 | $431,900 |
| 2022 | $11,927 | $960,300 | $535,300 | $425,000 |
| 2021 | $12,702 | $985,400 | $535,300 | $450,100 |
| 2020 | $12,465 | $970,800 | $535,300 | $435,500 |
| 2019 | $12,552 | $970,800 | $535,300 | $435,500 |
| 2018 | $12,229 | $952,400 | $535,300 | $417,100 |
| 2017 | $12,100 | $927,200 | $491,800 | $435,400 |
| 2016 | $12,412 | $963,700 | $491,800 | $471,900 |
| 2015 | $11,378 | $895,900 | $467,800 | $428,100 |
Source: Public Records
Map
Nearby Homes
Your Personal Tour Guide
Ask me questions while you tour the home.