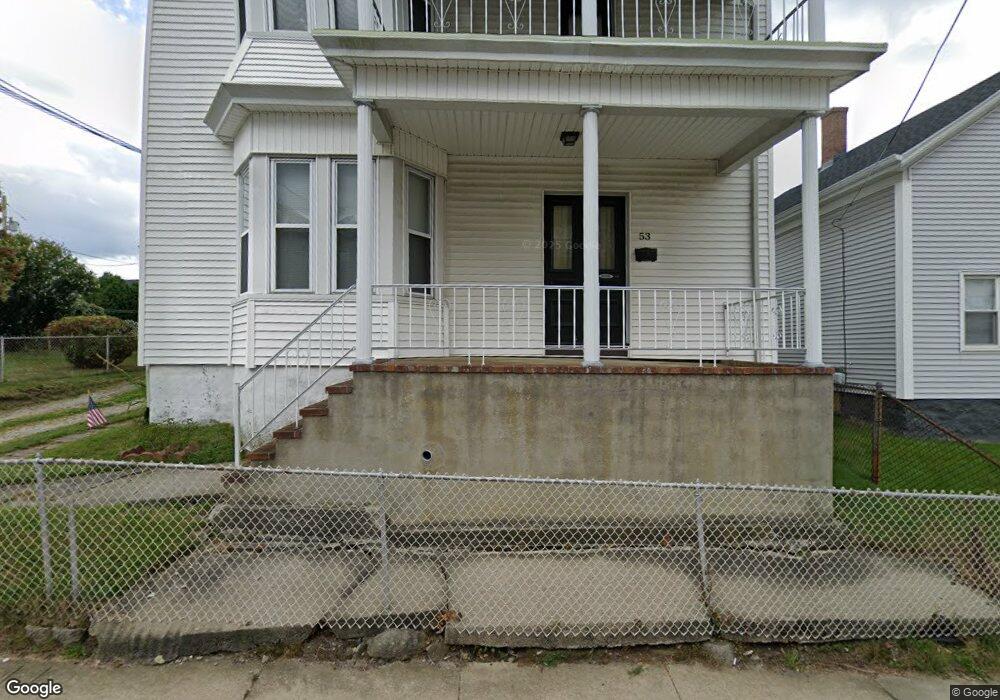
53 Globe St Fall River, MA 02724
Sandy Beach NeighborhoodEstimated Value: $467,000 - $612,000
6
Beds
3
Baths
3,240
Sq Ft
$169/Sq Ft
Est. Value
About This Home
This home is located at 53 Globe St, Fall River, MA 02724 and is currently estimated at $548,667, approximately $169 per square foot. 53 Globe St is a home located in Bristol County with nearby schools including Carlton M. Viveiros Elementary School, Matthew J. Kuss Middle School, and B M C Durfee High School.
Ownership History
Date
Name
Owned For
Owner Type
Purchase Details
Closed on
Feb 19, 2015
Sold by
Globe Street Nt and Mello
Bought by
Mello John P
Current Estimated Value
Create a Home Valuation Report for This Property
The Home Valuation Report is an in-depth analysis detailing your home's value as well as a comparison with similar homes in the area
Home Values in the Area
Average Home Value in this Area
Purchase History
| Date | Buyer | Sale Price | Title Company |
|---|---|---|---|
| Mello John P | -- | -- | |
| Mello John P | -- | -- |
Source: Public Records
Mortgage History
| Date | Status | Borrower | Loan Amount |
|---|---|---|---|
| Previous Owner | Mello John P | $50,000 | |
| Previous Owner | Mello John P | $25,000 |
Source: Public Records
Tax History
| Year | Tax Paid | Tax Assessment Tax Assessment Total Assessment is a certain percentage of the fair market value that is determined by local assessors to be the total taxable value of land and additions on the property. | Land | Improvement |
|---|---|---|---|---|
| 2025 | $5,668 | $495,000 | $107,800 | $387,200 |
| 2024 | $5,422 | $471,900 | $103,800 | $368,100 |
| 2023 | $4,753 | $387,400 | $85,800 | $301,600 |
| 2022 | $4,229 | $335,100 | $81,700 | $253,400 |
| 2021 | $4,000 | $289,200 | $77,700 | $211,500 |
| 2020 | $3,604 | $249,400 | $76,600 | $172,800 |
| 2019 | $3,076 | $211,000 | $73,700 | $137,300 |
| 2018 | $2,971 | $203,200 | $79,900 | $123,300 |
| 2017 | $2,792 | $199,400 | $76,100 | $123,300 |
| 2016 | $2,742 | $201,200 | $81,000 | $120,200 |
| 2015 | $2,632 | $201,200 | $81,000 | $120,200 |
| 2014 | $2,644 | $210,200 | $78,600 | $131,600 |
Source: Public Records
Map
Nearby Homes
- 245 Dwelly St
- 464 Birch St
- 20 Wilcox St
- 609 King Philip St
- 1846 S Main St
- 1852 S Main St
- 1334 S Main St
- 1273-1279 S Main St
- 234 Kilburn St
- 70 Brown St
- 15 Higgins St
- 57 Larouche St
- 917 Dwelly St
- 344-354 E Main St
- 616 Woodman St
- 219 Montaup St
- 71 Mystic St Unit 3
- 126 Wheeler St
- 240 Montaup St
- 82 Montaup St
Your Personal Tour Guide
Ask me questions while you tour the home.