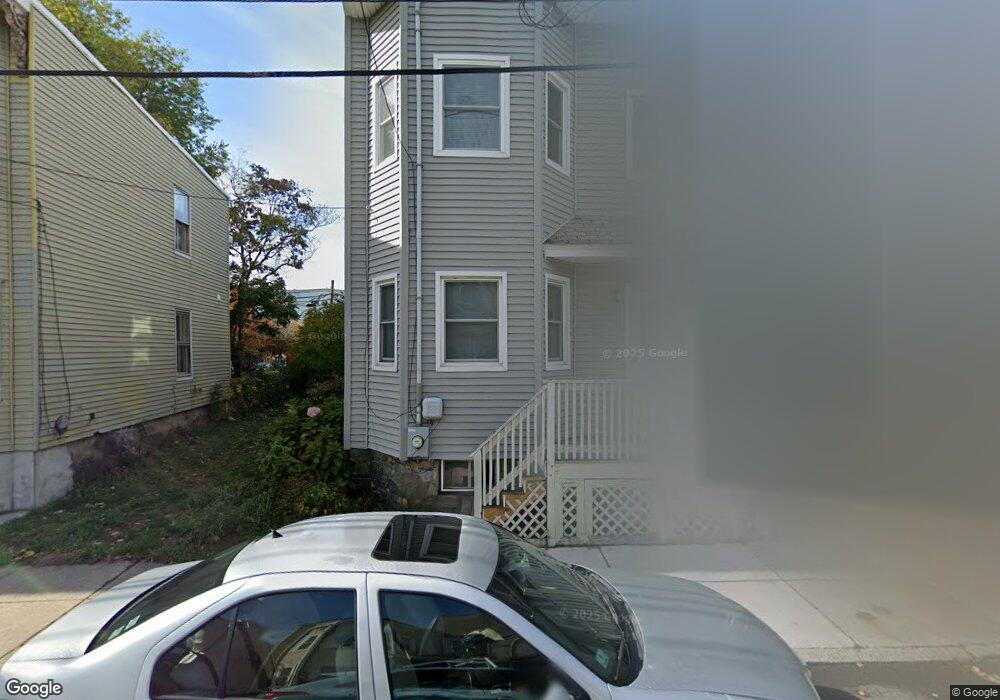
53 Hano St Allston, MA 02134
Allston NeighborhoodEstimated Value: $740,000 - $791,000
3
Beds
1
Bath
1,422
Sq Ft
$535/Sq Ft
Est. Value
About This Home
This home is located at 53 Hano St, Allston, MA 02134 and is currently estimated at $760,994, approximately $535 per square foot. 53 Hano St is a home located in Suffolk County with nearby schools including Match Charter Public School, Boston Green Academy Horace Mann Charter School, and German International School Boston.
Ownership History
Date
Name
Owned For
Owner Type
Purchase Details
Closed on
Jan 28, 2020
Sold by
Fagan Patricia
Bought by
Patricia E Fagan Lt
Current Estimated Value
Purchase Details
Closed on
Jan 9, 1989
Sold by
Flibotte Jeanette
Bought by
Fagan Patricia E
Home Financials for this Owner
Home Financials are based on the most recent Mortgage that was taken out on this home.
Original Mortgage
$108,800
Interest Rate
10.32%
Mortgage Type
Purchase Money Mortgage
Create a Home Valuation Report for This Property
The Home Valuation Report is an in-depth analysis detailing your home's value as well as a comparison with similar homes in the area
Home Values in the Area
Average Home Value in this Area
Purchase History
| Date | Buyer | Sale Price | Title Company |
|---|---|---|---|
| Patricia E Fagan Lt | -- | None Available | |
| Fagan Patricia E | $136,000 | -- |
Source: Public Records
Mortgage History
| Date | Status | Borrower | Loan Amount |
|---|---|---|---|
| Previous Owner | Fagan Patricia E | $108,800 |
Source: Public Records
Tax History Compared to Growth
Tax History
| Year | Tax Paid | Tax Assessment Tax Assessment Total Assessment is a certain percentage of the fair market value that is determined by local assessors to be the total taxable value of land and additions on the property. | Land | Improvement |
|---|---|---|---|---|
| 2025 | $7,385 | $637,700 | $156,300 | $481,400 |
| 2024 | $6,506 | $596,900 | $164,500 | $432,400 |
| 2023 | $6,411 | $596,900 | $164,500 | $432,400 |
| 2022 | $6,303 | $579,300 | $159,600 | $419,700 |
| 2021 | $5,832 | $546,600 | $150,600 | $396,000 |
| 2020 | $5,108 | $483,700 | $132,100 | $351,600 |
| 2019 | $4,722 | $448,000 | $110,900 | $337,100 |
| 2018 | $4,559 | $435,000 | $110,900 | $324,100 |
| 2017 | $4,559 | $430,500 | $110,900 | $319,600 |
| 2016 | $4,467 | $406,100 | $110,900 | $295,200 |
| 2015 | $3,829 | $316,200 | $104,800 | $211,400 |
| 2014 | $3,461 | $275,100 | $104,800 | $170,300 |
Source: Public Records
Map
Nearby Homes
- 30 Penniman Rd Unit 201
- 20 Penniman Rd Unit 208
- 15 N Beacon St Unit 328
- 15 N Beacon St Unit 412
- 15 N Beacon St Unit L01
- 15 N Beacon St Unit 401
- 533 Cambridge St Unit 105
- 8 Franklin St Unit 202
- 8 Franklin St Unit 403
- 8 Franklin St Unit 401
- 581 Cambridge St
- 1 Highgate St
- 100 Lincoln St Unit 403
- 100 Lincoln St Unit 302
- 100 Lincoln St Unit 507
- 100 Lincoln St Unit 306
- 100 Lincoln St Unit 307
- 100 Lincoln St Unit 303
- 178 Brighton Ave Unit 12
- 56 Park Vale Ave Unit 4