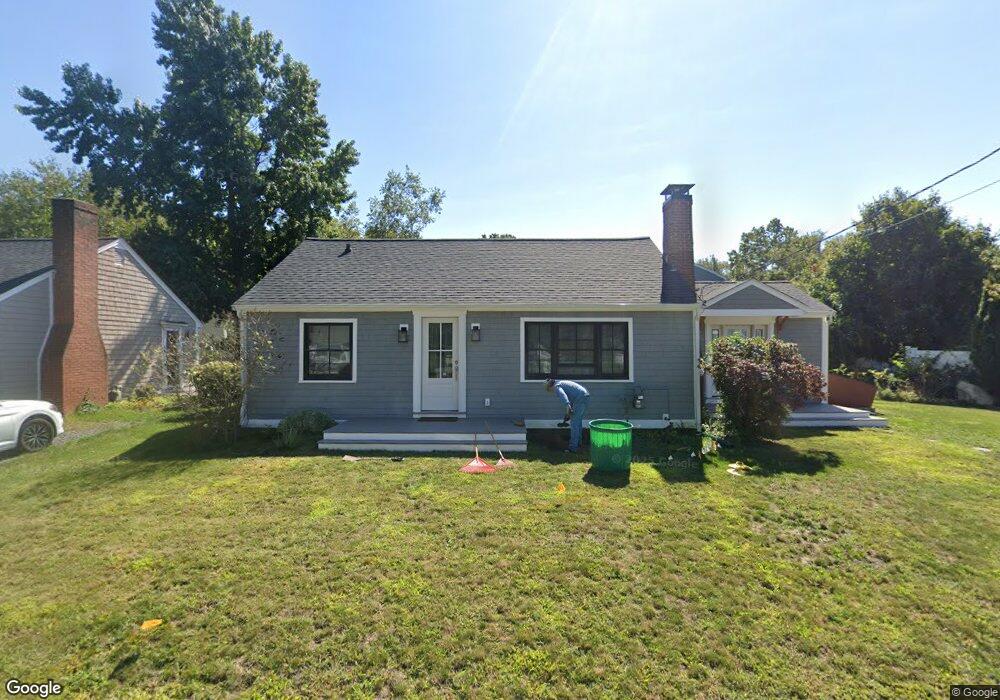
53 Hawley Rd Scituate, MA 02066
Estimated Value: $588,000 - $853,000
2
Beds
1
Bath
768
Sq Ft
$957/Sq Ft
Est. Value
About This Home
This home is located at 53 Hawley Rd, Scituate, MA 02066 and is currently estimated at $735,021, approximately $957 per square foot. 53 Hawley Rd is a home located in Plymouth County with nearby schools including Wampatuck Elementary School, Lester J. Gates Middle School, and Scituate High School.
Ownership History
Date
Name
Owned For
Owner Type
Purchase Details
Closed on
Sep 11, 2009
Sold by
Newhall Christopher P and Newhall Jennifer
Bought by
Roake Brian F
Current Estimated Value
Home Financials for this Owner
Home Financials are based on the most recent Mortgage that was taken out on this home.
Original Mortgage
$248,000
Outstanding Balance
$163,586
Interest Rate
5.36%
Mortgage Type
Purchase Money Mortgage
Estimated Equity
$571,435
Purchase Details
Closed on
Sep 12, 2003
Sold by
Meschini Lynn A
Bought by
Newhall Christopher P and Shea Jennifer G
Purchase Details
Closed on
Aug 3, 1998
Sold by
Andrew Karen
Bought by
Meschini Lynn A
Create a Home Valuation Report for This Property
The Home Valuation Report is an in-depth analysis detailing your home's value as well as a comparison with similar homes in the area
Home Values in the Area
Average Home Value in this Area
Purchase History
| Date | Buyer | Sale Price | Title Company |
|---|---|---|---|
| Roake Brian F | $314,500 | -- | |
| Newhall Christopher P | $291,500 | -- | |
| Meschini Lynn A | $149,000 | -- |
Source: Public Records
Mortgage History
| Date | Status | Borrower | Loan Amount |
|---|---|---|---|
| Open | Meschini Lynn A | $248,000 | |
| Previous Owner | Meschini Lynn A | $282,500 |
Source: Public Records
Tax History Compared to Growth
Tax History
| Year | Tax Paid | Tax Assessment Tax Assessment Total Assessment is a certain percentage of the fair market value that is determined by local assessors to be the total taxable value of land and additions on the property. | Land | Improvement |
|---|---|---|---|---|
| 2025 | $6,508 | $651,500 | $386,400 | $265,100 |
| 2024 | $6,332 | $611,200 | $351,300 | $259,900 |
| 2023 | $4,729 | $459,100 | $319,300 | $139,800 |
| 2022 | $4,729 | $374,700 | $261,900 | $112,800 |
| 2021 | $4,426 | $332,000 | $237,000 | $95,000 |
| 2020 | $4,242 | $314,200 | $227,800 | $86,400 |
| 2019 | $4,189 | $304,900 | $223,400 | $81,500 |
| 2018 | $4,292 | $307,700 | $240,800 | $66,900 |
| 2017 | $4,193 | $297,600 | $230,700 | $66,900 |
| 2016 | $3,925 | $277,600 | $210,700 | $66,900 |
| 2015 | $3,504 | $267,500 | $200,600 | $66,900 |
Source: Public Records
Map
Nearby Homes
- 30 Irving Rd
- 209 Hatherly Rd
- 10 Benjamin Ln Unit 10
- 378 Tilden Rd
- 22 Kings Way
- 17 Bradford Ave
- 2 Windward Ln
- 54 Woodland Rd
- 23 Oceanside Dr
- 27 Ann Vinal Rd
- 59 Captain Peirce Rd
- 105 Turner Rd
- 32 Barker Rd Unit 3
- 74 Tilden Rd
- 14 Aberdeen Dr
- 3 Grace Way Unit 3
- 1 Grace Way Unit 1
- 111 Elm St
- 32 Fairview Ave
- 115 Elm St