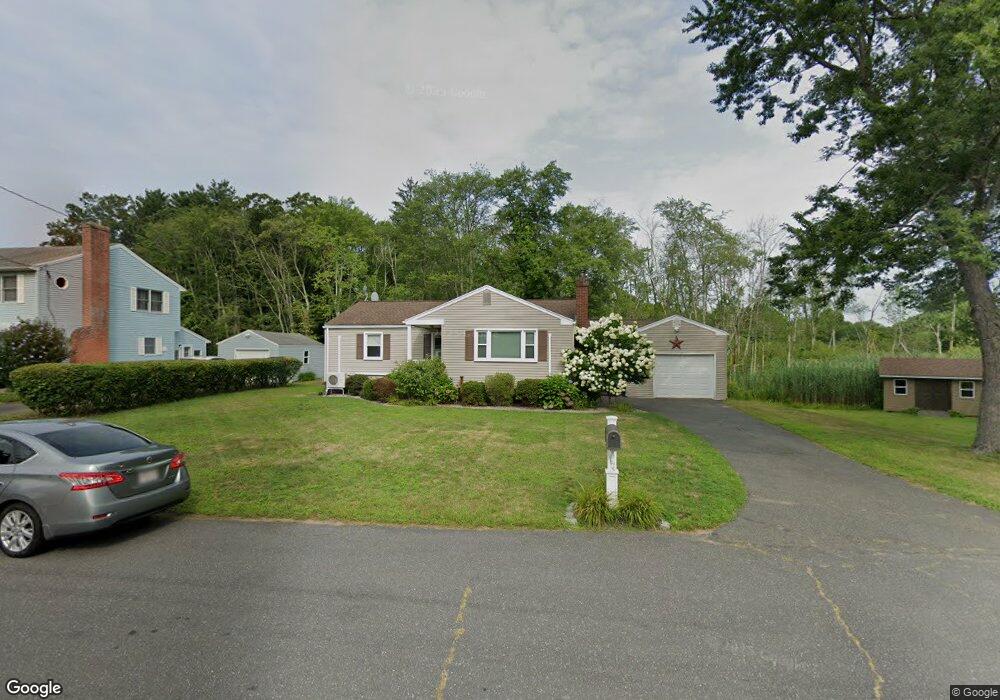
53 Higher St Unit 1 Ludlow, MA 01056
Estimated Value: $307,000 - $311,000
3
Beds
1
Bath
1,065
Sq Ft
$290/Sq Ft
Est. Value
About This Home
This home is located at 53 Higher St Unit 1, Ludlow, MA 01056 and is currently estimated at $308,684, approximately $289 per square foot. 53 Higher St Unit 1 is a home located in Hampden County with nearby schools including East Street Elementary School, Chapin Street Elementary School, and Paul R. Baird Middle School.
Ownership History
Date
Name
Owned For
Owner Type
Purchase Details
Closed on
Jul 13, 2012
Sold by
Roberts Timothy J and Roberts Amy
Bought by
Luszcz Jessica L
Current Estimated Value
Home Financials for this Owner
Home Financials are based on the most recent Mortgage that was taken out on this home.
Original Mortgage
$135,520
Outstanding Balance
$93,945
Interest Rate
3.76%
Mortgage Type
New Conventional
Estimated Equity
$214,739
Purchase Details
Closed on
Aug 21, 2009
Sold by
Miele Deborah and Costa John Rafael
Bought by
Roberts Timothy J
Home Financials for this Owner
Home Financials are based on the most recent Mortgage that was taken out on this home.
Original Mortgage
$139,600
Interest Rate
5.19%
Mortgage Type
Purchase Money Mortgage
Create a Home Valuation Report for This Property
The Home Valuation Report is an in-depth analysis detailing your home's value as well as a comparison with similar homes in the area
Home Values in the Area
Average Home Value in this Area
Purchase History
| Date | Buyer | Sale Price | Title Company |
|---|---|---|---|
| Luszcz Jessica L | $176,000 | -- | |
| Roberts Timothy J | $174,500 | -- |
Source: Public Records
Mortgage History
| Date | Status | Borrower | Loan Amount |
|---|---|---|---|
| Open | Luszcz Jessica L | $135,520 | |
| Closed | Luszcz Jessica L | $35,200 | |
| Previous Owner | Roberts Timothy J | $139,600 |
Source: Public Records
Tax History
| Year | Tax Paid | Tax Assessment Tax Assessment Total Assessment is a certain percentage of the fair market value that is determined by local assessors to be the total taxable value of land and additions on the property. | Land | Improvement |
|---|---|---|---|---|
| 2025 | $4,421 | $254,800 | $93,200 | $161,600 |
| 2024 | $4,269 | $236,000 | $93,300 | $142,700 |
| 2023 | $3,929 | $201,400 | $77,600 | $123,800 |
| 2022 | $3,756 | $187,900 | $77,600 | $110,300 |
| 2021 | $3,782 | $179,400 | $77,600 | $101,800 |
| 2020 | $3,623 | $175,700 | $76,400 | $99,300 |
| 2019 | $3,367 | $169,900 | $75,600 | $94,300 |
| 2018 | $3,161 | $166,300 | $75,600 | $90,700 |
| 2017 | $3,117 | $168,200 | $77,100 | $91,100 |
| 2016 | $2,964 | $163,500 | $75,500 | $88,000 |
| 2015 | $2,811 | $162,600 | $74,800 | $87,800 |
Source: Public Records
Map
Nearby Homes
- 70 Sroka Ln
- 84 Chapin Greene Dr
- 665 Center St Unit 706
- 676 Chapin St
- 259 Prospect St
- 102 Swan Ave
- 162 Highland Ave
- 31 Greenwich St
- 98 Fuller St Unit 32
- 59 Prospect St
- 374 East St
- '0' Rood St
- 70 Fuller St
- 37 Waters Edge Unit 37
- 63 Oak St
- 287 East St
- 0 Fuller St Unit 73409741
- 350 West Ave Unit 5
- 25 Dale St
- 37 Franklin St
Your Personal Tour Guide
Ask me questions while you tour the home.