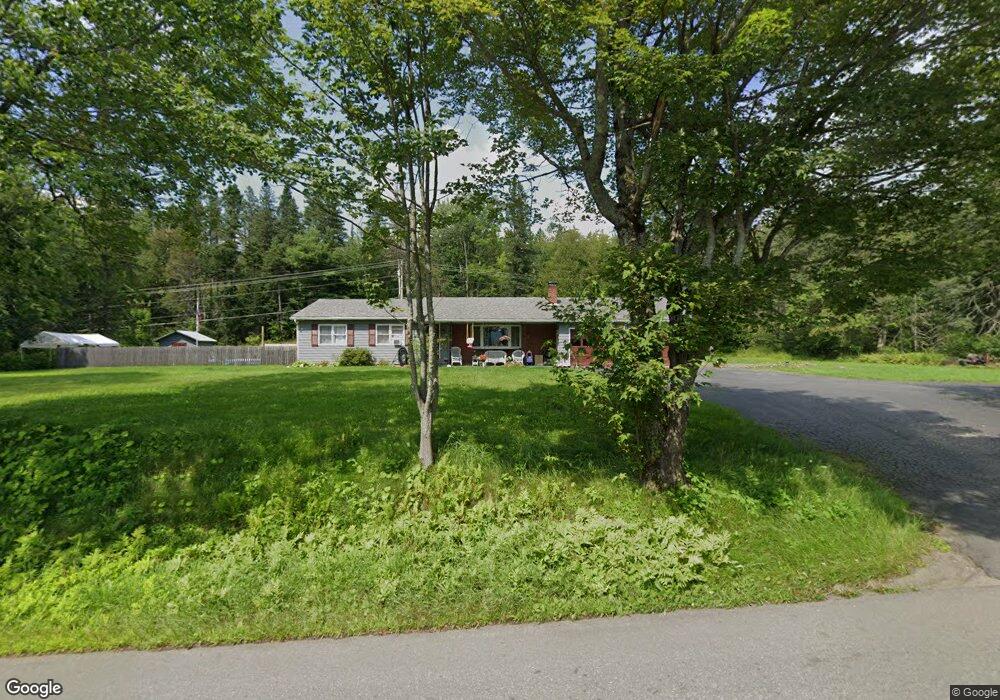
53 Hughes Rd Colebrook, NH 03576
Estimated Value: $279,000 - $406,000
3
Beds
1
Bath
2,133
Sq Ft
$156/Sq Ft
Est. Value
About This Home
This home is located at 53 Hughes Rd, Colebrook, NH 03576 and is currently estimated at $333,333, approximately $156 per square foot. 53 Hughes Rd is a home located in Coos County with nearby schools including Colebrook Elementary School, Colebrook Academy, and Camp E-Toh-Anee.
Ownership History
Date
Name
Owned For
Owner Type
Purchase Details
Closed on
Oct 3, 2018
Sold by
Call Nancy H
Bought by
Wheelock Jordan C and Wheelock Kristen R
Current Estimated Value
Home Financials for this Owner
Home Financials are based on the most recent Mortgage that was taken out on this home.
Original Mortgage
$103,500
Outstanding Balance
$90,258
Interest Rate
4.5%
Mortgage Type
New Conventional
Estimated Equity
$243,075
Purchase Details
Closed on
Oct 30, 2017
Sold by
Haynes Frances Est
Bought by
Haynes-Call Nancy
Create a Home Valuation Report for This Property
The Home Valuation Report is an in-depth analysis detailing your home's value as well as a comparison with similar homes in the area
Home Values in the Area
Average Home Value in this Area
Purchase History
| Date | Buyer | Sale Price | Title Company |
|---|---|---|---|
| Wheelock Jordan C | $115,000 | -- | |
| Haynes-Call Nancy | -- | -- |
Source: Public Records
Mortgage History
| Date | Status | Borrower | Loan Amount |
|---|---|---|---|
| Open | Wheelock Jordan C | $103,500 |
Source: Public Records
Tax History Compared to Growth
Tax History
| Year | Tax Paid | Tax Assessment Tax Assessment Total Assessment is a certain percentage of the fair market value that is determined by local assessors to be the total taxable value of land and additions on the property. | Land | Improvement |
|---|---|---|---|---|
| 2024 | $5,361 | $153,300 | $25,000 | $128,300 |
| 2023 | $4,853 | $153,300 | $25,000 | $128,300 |
| 2022 | $4,341 | $153,300 | $25,000 | $128,300 |
| 2021 | $4,495 | $153,300 | $25,000 | $128,300 |
| 2020 | $4,259 | $153,300 | $25,000 | $128,300 |
| 2019 | $4,619 | $153,300 | $25,000 | $128,300 |
| 2018 | $4,257 | $141,300 | $31,000 | $110,300 |
| 2017 | $4,167 | $141,300 | $31,000 | $110,300 |
| 2016 | $4,028 | $141,300 | $31,000 | $110,300 |
| 2015 | $4,082 | $141,300 | $31,000 | $110,300 |
| 2014 | $4,091 | $141,300 | $31,000 | $110,300 |
| 2013 | $3,308 | $143,400 | $36,200 | $107,200 |
Source: Public Records
Map
Nearby Homes