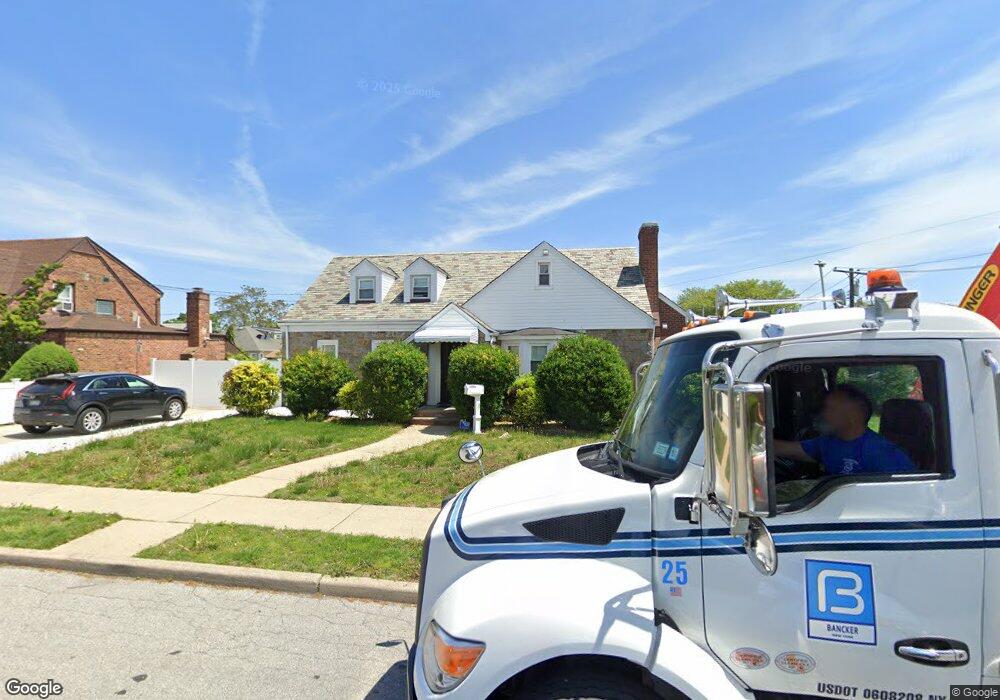
53 Jefferson St Franklin Square, NY 11010
Estimated Value: $816,000 - $857,706
--
Bed
3
Baths
2,174
Sq Ft
$385/Sq Ft
Est. Value
About This Home
This home is located at 53 Jefferson St, Franklin Square, NY 11010 and is currently estimated at $836,853, approximately $384 per square foot. 53 Jefferson St is a home located in Nassau County with nearby schools including St Anne's School.
Ownership History
Date
Name
Owned For
Owner Type
Purchase Details
Closed on
Mar 6, 2023
Sold by
Lagattula Salvatore and Lagattula Antonino
Bought by
Larosa Vincent J and Larosa Jennifer
Current Estimated Value
Home Financials for this Owner
Home Financials are based on the most recent Mortgage that was taken out on this home.
Original Mortgage
$540,000
Outstanding Balance
$523,108
Interest Rate
6.15%
Mortgage Type
New Conventional
Estimated Equity
$313,745
Purchase Details
Closed on
Nov 30, 2022
Sold by
Sireno Giovanna and Antonio Barone 2006 Irrevocable Trust
Bought by
Lagattula Antonino and Lagattula Salvatore
Purchase Details
Closed on
Nov 29, 2006
Sold by
Barone Antonino
Purchase Details
Closed on
Aug 5, 1998
Purchase Details
Closed on
Nov 21, 1996
Sold by
Capogna Custom Homes Inc
Bought by
Barone Antonino and Barone Salvatrice
Purchase Details
Closed on
Nov 15, 1995
Sold by
Hoffman Margaret
Bought by
Capogna Custom Homes Inc
Create a Home Valuation Report for This Property
The Home Valuation Report is an in-depth analysis detailing your home's value as well as a comparison with similar homes in the area
Home Values in the Area
Average Home Value in this Area
Purchase History
| Date | Buyer | Sale Price | Title Company |
|---|---|---|---|
| Larosa Vincent J | $675,000 | First Choice Settlement Llc | |
| Lagattula Antonino | -- | Fidelity National Ttl Ins Co | |
| -- | -- | -- | |
| -- | -- | -- | |
| Barone Antonino | $180,000 | -- | |
| Capogna Custom Homes Inc | $255,000 | -- |
Source: Public Records
Mortgage History
| Date | Status | Borrower | Loan Amount |
|---|---|---|---|
| Open | Larosa Vincent J | $540,000 |
Source: Public Records
Tax History Compared to Growth
Tax History
| Year | Tax Paid | Tax Assessment Tax Assessment Total Assessment is a certain percentage of the fair market value that is determined by local assessors to be the total taxable value of land and additions on the property. | Land | Improvement |
|---|---|---|---|---|
| 2025 | $12,496 | $574 | $321 | $253 |
| 2024 | $4,798 | $564 | $315 | $249 |
| 2023 | $8,682 | $574 | $321 | $253 |
| 2022 | $8,682 | $574 | $321 | $253 |
| 2021 | $9,877 | $574 | $290 | $284 |
| 2020 | $7,076 | $645 | $395 | $250 |
| 2019 | $7,602 | $692 | $398 | $294 |
| 2018 | $7,710 | $738 | $0 | $0 |
| 2017 | $4,289 | $784 | $404 | $380 |
| 2016 | $8,256 | $823 | $403 | $420 |
| 2015 | $3,694 | $823 | $403 | $420 |
| 2014 | $3,694 | $823 | $403 | $420 |
| 2013 | $3,615 | $866 | $424 | $442 |
Source: Public Records
Map
Nearby Homes
- 31 Claflin Blvd
- 23 Monroe St
- 32 Madison Ave
- 144 Rintin St
- 190 Commonwealth St
- 115 Madison Ave
- 775 Roosevelt St
- 1022 Rosegold St
- 78 New Hyde Park Rd
- 56 Fendale St
- 242 James St
- 1041 Russell St
- 715 Iris St
- 249 Hoffman St
- 166 Franklin St
- 51 Pacific St
- 676 Sobo Ave
- 249 Grange St
- 170 Mckinley Ave
- 109 Caroline Ave
- 872 Gabriel Ave
- 35 Jefferson St
- 866 Gabriel Ave
- 52 Jefferson St
- 48 Jefferson St
- 59 Jefferson St
- 56 Jefferson St
- 867 Liberty Place
- 875 Gabriel Ave
- 44 Jefferson St
- 60 Jefferson St
- 869 Gabriel Ave
- 40 Jefferson St
- 862 Gabriel Ave
- 64 Jefferson St
- 865 Gabriel Ave
- 36 Jefferson St
- 68 Jefferson St
- 861 Gabriel Ave
- 32 Jefferson St