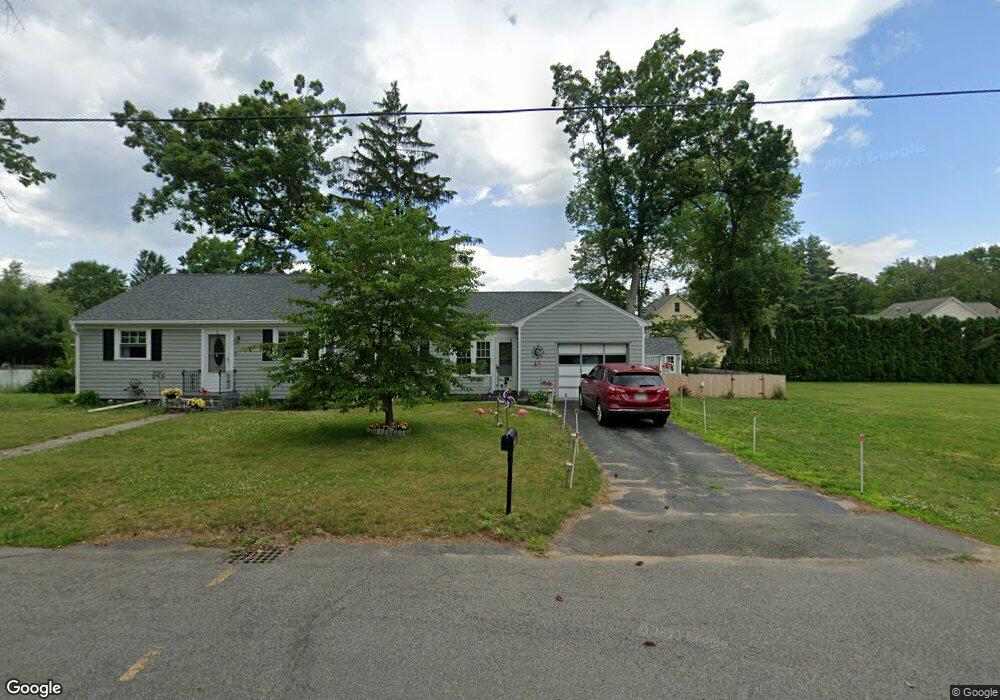
53 Mutter St Easthampton, MA 01027
Estimated Value: $322,000 - $374,476
3
Beds
2
Baths
1,064
Sq Ft
$332/Sq Ft
Est. Value
About This Home
This home is located at 53 Mutter St, Easthampton, MA 01027 and is currently estimated at $353,619, approximately $332 per square foot. 53 Mutter St is a home located in Hampshire County with nearby schools including Easthampton High School, Tri-County Schools, and New England Adolescent Research Institute.
Ownership History
Date
Name
Owned For
Owner Type
Purchase Details
Closed on
Jun 28, 2018
Sold by
Cooper David M
Bought by
Jeanne & David Cooper Re
Current Estimated Value
Purchase Details
Closed on
May 24, 2018
Sold by
Cooper Elaine M Est
Bought by
Cooper David M
Purchase Details
Closed on
Jul 31, 2001
Sold by
Leary Shaun M and Leary Timothy R
Bought by
Kabat Elaine M
Home Financials for this Owner
Home Financials are based on the most recent Mortgage that was taken out on this home.
Original Mortgage
$104,000
Interest Rate
7.18%
Mortgage Type
Purchase Money Mortgage
Purchase Details
Closed on
Jul 1, 1996
Sold by
Leary Mildred P
Bought by
Leary Shaun M and Leary Timothy R
Home Financials for this Owner
Home Financials are based on the most recent Mortgage that was taken out on this home.
Original Mortgage
$125,000
Interest Rate
8.05%
Mortgage Type
Purchase Money Mortgage
Create a Home Valuation Report for This Property
The Home Valuation Report is an in-depth analysis detailing your home's value as well as a comparison with similar homes in the area
Home Values in the Area
Average Home Value in this Area
Purchase History
| Date | Buyer | Sale Price | Title Company |
|---|---|---|---|
| Jeanne & David Cooper Re | -- | -- | |
| Cooper David M | -- | -- | |
| Kabat Elaine M | $130,000 | -- | |
| Leary Shaun M | $125,000 | -- |
Source: Public Records
Mortgage History
| Date | Status | Borrower | Loan Amount |
|---|---|---|---|
| Previous Owner | Leary Shaun M | $116,000 | |
| Previous Owner | Leary Shaun M | $104,000 | |
| Previous Owner | Leary Shaun M | $125,000 |
Source: Public Records
Tax History
| Year | Tax Paid | Tax Assessment Tax Assessment Total Assessment is a certain percentage of the fair market value that is determined by local assessors to be the total taxable value of land and additions on the property. | Land | Improvement |
|---|---|---|---|---|
| 2025 | $4,171 | $305,100 | $107,900 | $197,200 |
| 2024 | $4,025 | $296,800 | $104,700 | $192,100 |
| 2023 | $2,912 | $198,800 | $82,500 | $116,300 |
| 2022 | $3,286 | $198,800 | $82,500 | $116,300 |
| 2021 | $3,592 | $204,800 | $82,500 | $122,300 |
| 2020 | $3,531 | $198,800 | $82,500 | $116,300 |
| 2019 | $2,962 | $191,600 | $82,500 | $109,100 |
| 2018 | $2,837 | $177,300 | $77,800 | $99,500 |
| 2017 | $2,767 | $170,700 | $74,800 | $95,900 |
| 2016 | $2,769 | $177,600 | $74,800 | $102,800 |
| 2015 | $2,691 | $177,600 | $74,800 | $102,800 |
Source: Public Records
Map
Nearby Homes
- 19 Mount Tom Ave Unit 19
- 33 Knipfer Ave
- 19 Nicols Way Unit 19
- 12 Glen Cove Place Unit B
- 10 Glen Cove Place Unit A
- 6 S St & Abutting Lots
- 41 South St Unit 11
- 2 W Park Dr
- 385 Main St
- M143 &152 Glendale St
- 245 Park St
- 4 Laurel Dr
- 1 Plain St
- Lot 1 Edgewater Ln
- 95 Gunn Rd
- 36 Line St
- 457 Northampton St
- 38 College Hwy
- 296 Old Wilson Rd
- 98 Park Hill Rd