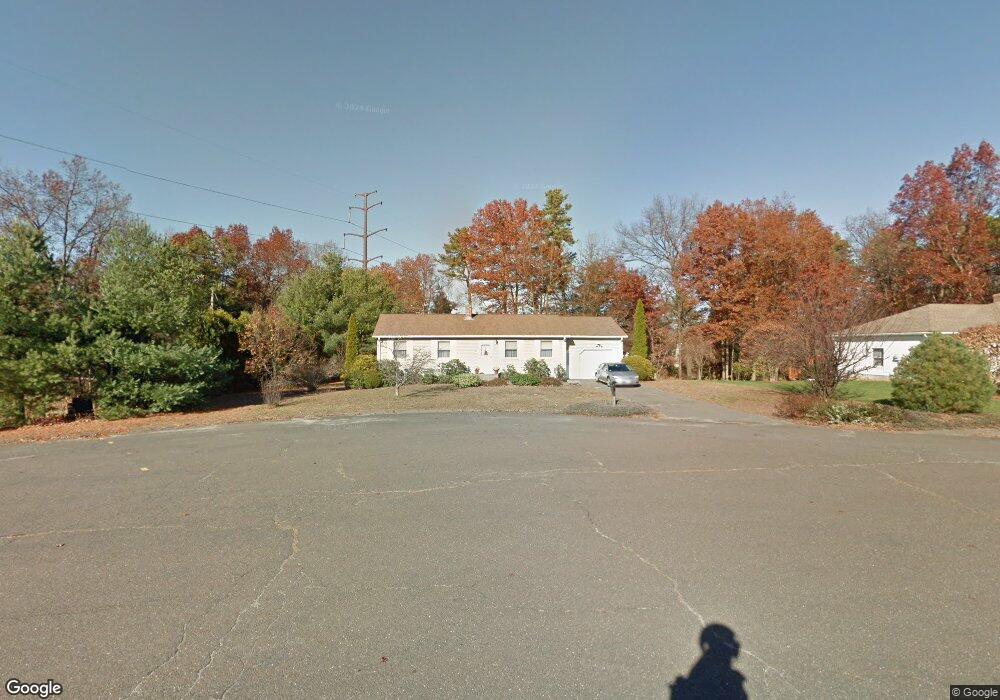
53 Overlook Dr Easthampton, MA 01027
Estimated Value: $372,821 - $410,000
3
Beds
2
Baths
1,092
Sq Ft
$358/Sq Ft
Est. Value
About This Home
This home is located at 53 Overlook Dr, Easthampton, MA 01027 and is currently estimated at $391,205, approximately $358 per square foot. 53 Overlook Dr is a home located in Hampshire County with nearby schools including Easthampton High School, Calvary Baptist Christian School, and Tri-County Schools.
Ownership History
Date
Name
Owned For
Owner Type
Purchase Details
Closed on
Aug 2, 1990
Sold by
Boyle David R
Bought by
Drabantowicz Walter
Current Estimated Value
Home Financials for this Owner
Home Financials are based on the most recent Mortgage that was taken out on this home.
Original Mortgage
$74,000
Interest Rate
10.02%
Mortgage Type
Purchase Money Mortgage
Create a Home Valuation Report for This Property
The Home Valuation Report is an in-depth analysis detailing your home's value as well as a comparison with similar homes in the area
Home Values in the Area
Average Home Value in this Area
Purchase History
| Date | Buyer | Sale Price | Title Company |
|---|---|---|---|
| Drabantowicz Walter | $119,000 | -- |
Source: Public Records
Mortgage History
| Date | Status | Borrower | Loan Amount |
|---|---|---|---|
| Open | Drabantowicz Walter | $67,000 | |
| Closed | Drabantowicz Walter | $74,000 | |
| Closed | Drabantowicz Walter | $74,000 |
Source: Public Records
Tax History
| Year | Tax Paid | Tax Assessment Tax Assessment Total Assessment is a certain percentage of the fair market value that is determined by local assessors to be the total taxable value of land and additions on the property. | Land | Improvement |
|---|---|---|---|---|
| 2025 | $4,523 | $330,900 | $114,600 | $216,300 |
| 2024 | $4,366 | $322,000 | $111,300 | $210,700 |
| 2023 | $3,298 | $225,100 | $87,700 | $137,400 |
| 2022 | $3,721 | $225,100 | $87,700 | $137,400 |
| 2021 | $4,073 | $232,200 | $87,700 | $144,500 |
| 2020 | $3,998 | $225,100 | $87,700 | $137,400 |
| 2019 | $3,233 | $209,100 | $87,700 | $121,400 |
| 2018 | $3,093 | $193,300 | $82,500 | $110,800 |
| 2017 | $3,018 | $186,200 | $79,300 | $106,900 |
| 2016 | $3,006 | $192,800 | $79,300 | $113,500 |
| 2015 | $2,921 | $192,800 | $79,300 | $113,500 |
Source: Public Records
Map
Nearby Homes
Your Personal Tour Guide
Ask me questions while you tour the home.