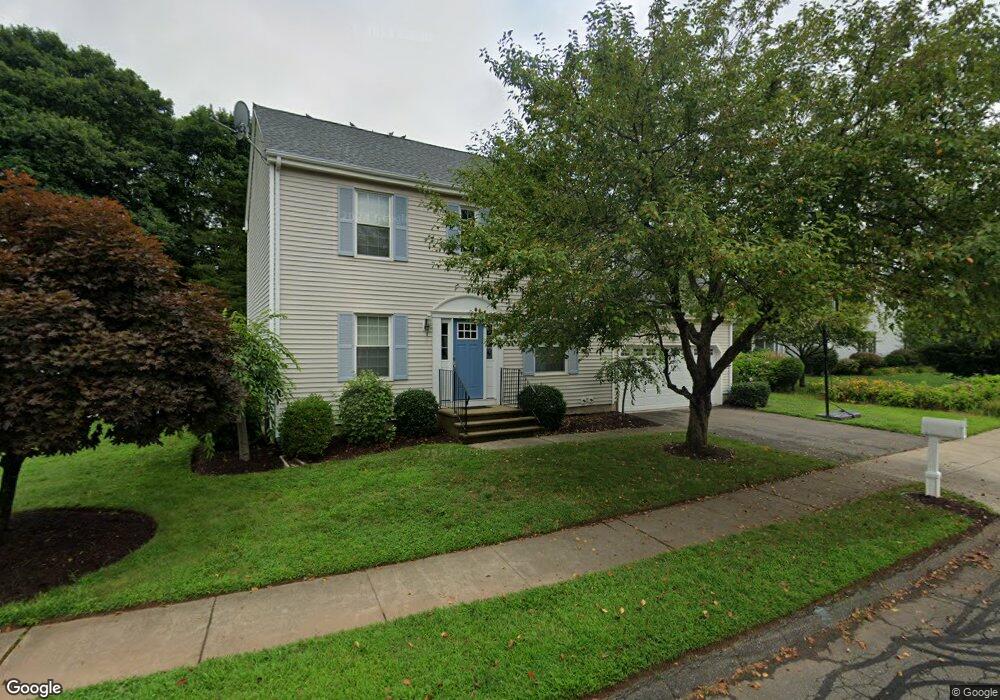
53 Pond Place Middletown, CT 06457
Westfield NeighborhoodEstimated Value: $418,000 - $487,000
3
Beds
3
Baths
1,632
Sq Ft
$280/Sq Ft
Est. Value
About This Home
This home is located at 53 Pond Place, Middletown, CT 06457 and is currently estimated at $457,765, approximately $280 per square foot. 53 Pond Place is a home located in Middlesex County with nearby schools including St John Paul II School.
Ownership History
Date
Name
Owned For
Owner Type
Purchase Details
Closed on
Jun 28, 2010
Sold by
Rom Einar and Rom Dawn
Bought by
Rose David A and Rose Heather L
Current Estimated Value
Home Financials for this Owner
Home Financials are based on the most recent Mortgage that was taken out on this home.
Original Mortgage
$236,000
Outstanding Balance
$158,245
Interest Rate
4.98%
Estimated Equity
$299,520
Purchase Details
Closed on
Jan 24, 2003
Sold by
Gonthier Thomas and Gonthier Kathryn
Bought by
Rom Einar and Rom Dawn
Create a Home Valuation Report for This Property
The Home Valuation Report is an in-depth analysis detailing your home's value as well as a comparison with similar homes in the area
Home Values in the Area
Average Home Value in this Area
Purchase History
| Date | Buyer | Sale Price | Title Company |
|---|---|---|---|
| Rose David A | $295,000 | -- | |
| Rom Einar | $268,000 | -- |
Source: Public Records
Mortgage History
| Date | Status | Borrower | Loan Amount |
|---|---|---|---|
| Open | Rom Einar | $236,000 | |
| Previous Owner | Rom Einar | $186,000 | |
| Previous Owner | Rom Einar | $186,000 |
Source: Public Records
Tax History Compared to Growth
Tax History
| Year | Tax Paid | Tax Assessment Tax Assessment Total Assessment is a certain percentage of the fair market value that is determined by local assessors to be the total taxable value of land and additions on the property. | Land | Improvement |
|---|---|---|---|---|
| 2025 | $9,631 | $247,580 | $70,820 | $176,760 |
| 2024 | $9,111 | $247,580 | $70,820 | $176,760 |
| 2023 | $8,380 | $238,760 | $70,820 | $167,940 |
| 2022 | $7,468 | $169,730 | $47,220 | $122,510 |
| 2021 | $7,468 | $169,730 | $47,220 | $122,510 |
| 2020 | $7,502 | $169,730 | $47,220 | $122,510 |
| 2019 | $7,536 | $169,730 | $47,220 | $122,510 |
| 2018 | $7,417 | $169,730 | $47,220 | $122,510 |
| 2017 | $7,378 | $174,000 | $45,120 | $128,880 |
| 2016 | $7,169 | $174,000 | $45,120 | $128,880 |
| 2015 | $6,890 | $174,000 | $45,120 | $128,880 |
| 2014 | $6,960 | $174,000 | $45,120 | $128,880 |
Source: Public Records
Map
Nearby Homes
- 142 Greenview Terrace
- 11 E Lake Dr
- 55 Timothy Dr
- 6 Coles Rd
- 123 Burgundy Hill Ln
- 36 Burgundy Hill Ln
- 48 Burgundy Hill Ln Unit 48
- 56 Burgundy Hill Ln Unit 56
- 38 Burgundy Hill Ln
- 229 Burgundy Hill Ln Unit 229
- 57 Burgundy Hill Ln
- 15 Clubhouse Dr Unit 15
- 7 Pheasant Run
- 55 Trolley Crossing Ln Unit 55
- 3 Trolley Crossing Ln
- 170 Trolley Crossing Ln Unit 170
- 7 Midway Dr
- 15 G Country Squire Dr Unit 15G
- 91C Country Squire Dr Unit 91C
- 30 Glenview Dr Unit 30