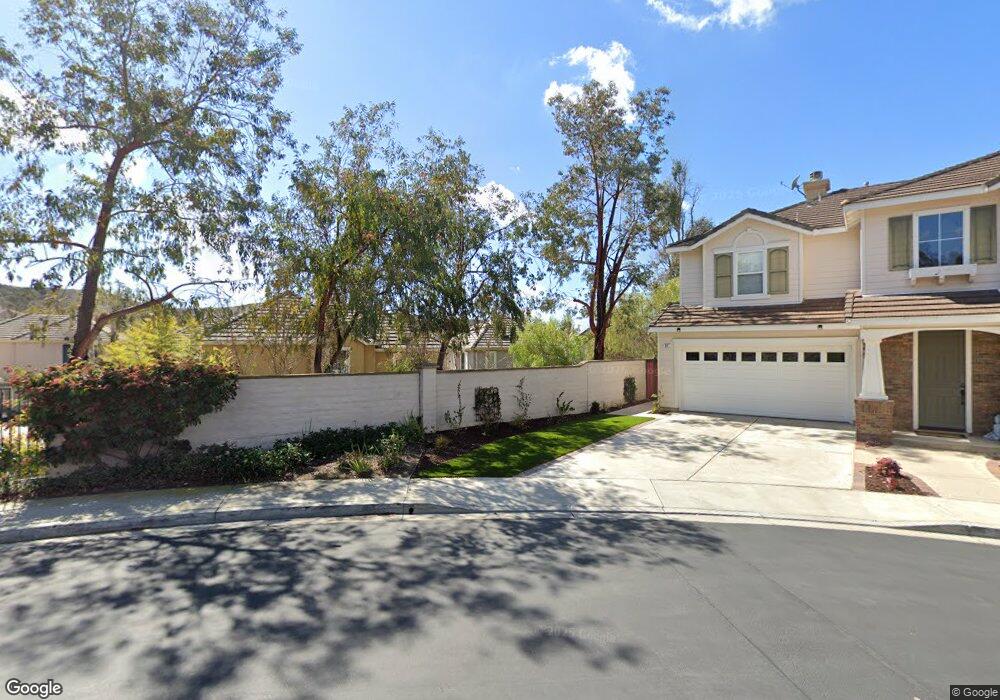
53 Poppyfield Ln Unit 60 Rancho Santa Margarita, CA 92688
Las Flores NeighborhoodEstimated Value: $919,000 - $941,803
3
Beds
2
Baths
1,438
Sq Ft
$648/Sq Ft
Est. Value
About This Home
This home is located at 53 Poppyfield Ln Unit 60, Rancho Santa Margarita, CA 92688 and is currently estimated at $931,451, approximately $647 per square foot. 53 Poppyfield Ln Unit 60 is a home located in Orange County with nearby schools including Las Flores Middle School, Tesoro High School, and St. Serra Catholic School.
Ownership History
Date
Name
Owned For
Owner Type
Purchase Details
Closed on
Apr 3, 2024
Sold by
Erma Elaine Rutherford Trust and Rutherford Thomas Troy
Bought by
Thomas Troy Trust and Rutherford
Current Estimated Value
Purchase Details
Closed on
Jul 26, 2013
Sold by
Rutherford Erma and Rutherford Erma Elaine
Bought by
Rutherford Erma Elaine and Erma Elaine Rutherford Trust
Purchase Details
Closed on
Nov 7, 2000
Sold by
Greaux Stephanie and Greaux Phillip
Bought by
Rutherford Roy and Rutherford Erma
Home Financials for this Owner
Home Financials are based on the most recent Mortgage that was taken out on this home.
Original Mortgage
$85,000
Interest Rate
7.86%
Purchase Details
Closed on
Mar 18, 1999
Sold by
Wl Homes Llc
Bought by
Greaux Phillip and Greaux Stephanie
Home Financials for this Owner
Home Financials are based on the most recent Mortgage that was taken out on this home.
Original Mortgage
$181,341
Interest Rate
6.25%
Create a Home Valuation Report for This Property
The Home Valuation Report is an in-depth analysis detailing your home's value as well as a comparison with similar homes in the area
Home Values in the Area
Average Home Value in this Area
Purchase History
| Date | Buyer | Sale Price | Title Company |
|---|---|---|---|
| Thomas Troy Trust | -- | None Listed On Document | |
| Rutherford Erma Elaine | -- | None Available | |
| Rutherford Roy | $270,000 | United Title Company | |
| Greaux Phillip | $201,500 | Chicago Title Co |
Source: Public Records
Mortgage History
| Date | Status | Borrower | Loan Amount |
|---|---|---|---|
| Previous Owner | Rutherford Roy | $85,000 | |
| Previous Owner | Greaux Phillip | $181,341 |
Source: Public Records
Tax History Compared to Growth
Tax History
| Year | Tax Paid | Tax Assessment Tax Assessment Total Assessment is a certain percentage of the fair market value that is determined by local assessors to be the total taxable value of land and additions on the property. | Land | Improvement |
|---|---|---|---|---|
| 2025 | $3,992 | $406,840 | $182,928 | $223,912 |
| 2024 | $3,992 | $398,863 | $179,341 | $219,522 |
| 2023 | $3,901 | $391,043 | $175,825 | $215,218 |
| 2022 | $3,825 | $383,376 | $172,377 | $210,999 |
| 2021 | $4,434 | $375,859 | $168,997 | $206,862 |
| 2020 | $4,487 | $372,006 | $167,265 | $204,741 |
| 2019 | $4,718 | $364,712 | $163,985 | $200,727 |
| 2018 | $4,647 | $357,561 | $160,769 | $196,792 |
| 2017 | $4,803 | $350,550 | $157,616 | $192,934 |
| 2016 | $4,817 | $343,677 | $154,526 | $189,151 |
| 2015 | $4,923 | $338,515 | $152,205 | $186,310 |
| 2014 | $4,880 | $331,884 | $149,223 | $182,661 |
Source: Public Records
Map
Nearby Homes
- 14 Poppyfield Ln
- 12 Poppyfield Ln
- 68 Radiance Ln
- 10 Summit Ct
- 12 Bel Flora
- 8 Tradition Ln
- 39 Legacy Way
- 94 Seacountry Ln
- 104 Seacountry Ln
- 19 Crestview Dr
- 16 Wyndham St
- 10 Edendale St
- 26101 Calle Cresta
- 16 Skywood St
- 18 Ash Hollow Trail
- 27721 Rubidoux
- 25311 Misty Ridge
- 26032 Ravenna Rd
- 26562 Via Mondelo
- 26035 Ravenna Rd
- 65 Bloomfield Ln Unit 105
- 36 Bloomfield Ln
- 6 Poppyfield Ln
- 4 Poppyfield Ln Unit 81
- 8 Poppyfield Ln Unit 83
- 10 Poppyfield Ln Unit 64
- 16 Poppyfield Ln Unit 87
- 18 Poppyfield Ln Unit 88
- 25 Poppyfield Ln Unit 73
- 18 Bloomfield Ln
- 20 Bloomfield Ln
- 20 Poppyfield Ln
- 22 Poppyfield Ln
- 16 Bloomfield Ln Unit 44
- 22 Bloomfield Ln
- 14 Bloomfield Ln
- 24 Bloomfield Ln
- 6 Bloomfield Ln
- 27 Poppyfield Ln
- 12 Bloomfield Ln