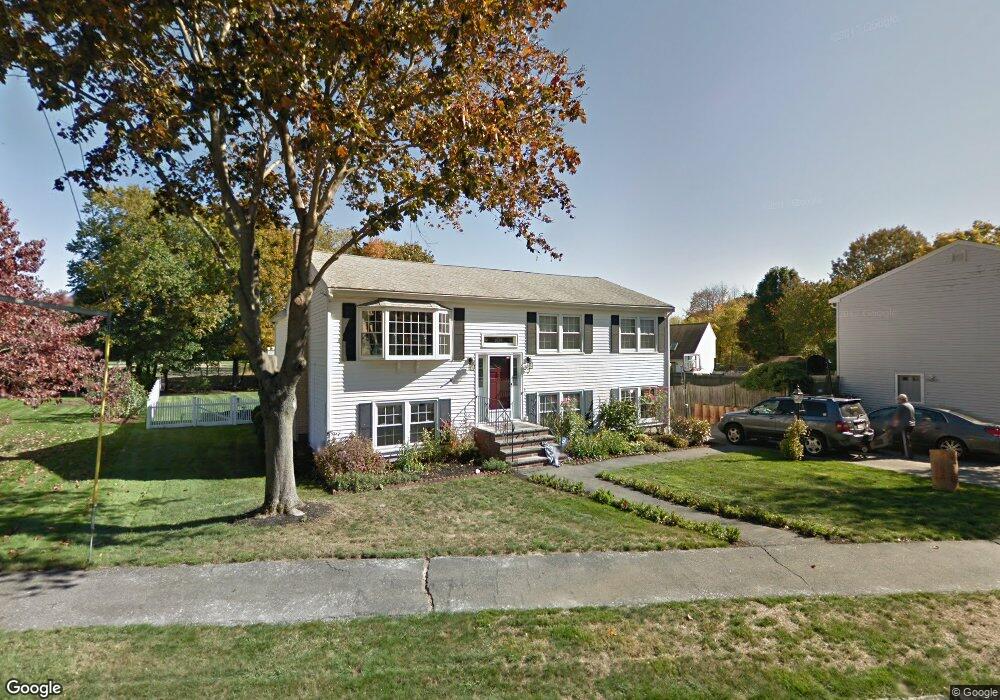
53 Riverside Dr Reading, MA 01867
Estimated Value: $958,000 - $1,110,319
3
Beds
2
Baths
2,576
Sq Ft
$409/Sq Ft
Est. Value
About This Home
This home is located at 53 Riverside Dr, Reading, MA 01867 and is currently estimated at $1,054,830, approximately $409 per square foot. 53 Riverside Dr is a home located in Middlesex County with nearby schools including Joshua Eaton Elementary School, Walter S. Parker Middle School, and Reading Memorial High School.
Ownership History
Date
Name
Owned For
Owner Type
Purchase Details
Closed on
Feb 28, 2018
Sold by
Conway Ft 2004 and Conway
Bought by
Conway Christopher C and Conway Lorraine A
Current Estimated Value
Purchase Details
Closed on
Jul 29, 2009
Sold by
Conway Lorraine A and Conway Christopher C
Bought by
Conway Ft and Conway
Home Financials for this Owner
Home Financials are based on the most recent Mortgage that was taken out on this home.
Original Mortgage
$405,600
Interest Rate
5.43%
Mortgage Type
Purchase Money Mortgage
Purchase Details
Closed on
Feb 20, 2004
Sold by
Conway Christopher C and Conway Lorraine A
Bought by
Conway Ft and Conway
Purchase Details
Closed on
Apr 30, 1997
Sold by
Thomas Edward G and Thomas Joan M
Bought by
Conway Christopher C and Conway Lorraine A
Purchase Details
Closed on
Jun 28, 1996
Sold by
Buck Andrew W and Buck Viwanna
Bought by
Thomas Edward G and Thomas Joan M
Purchase Details
Closed on
Jan 27, 1988
Sold by
Wu Polling C
Bought by
Buck Andrew W
Create a Home Valuation Report for This Property
The Home Valuation Report is an in-depth analysis detailing your home's value as well as a comparison with similar homes in the area
Home Values in the Area
Average Home Value in this Area
Purchase History
| Date | Buyer | Sale Price | Title Company |
|---|---|---|---|
| Conway Christopher C | -- | -- | |
| Conway Ft | -- | -- | |
| Conway Lorraine A | -- | -- | |
| Conway Ft | -- | -- | |
| Conway Christopher C | $281,000 | -- | |
| Thomas Edward G | $275,000 | -- | |
| Buck Andrew W | $246,000 | -- |
Source: Public Records
Mortgage History
| Date | Status | Borrower | Loan Amount |
|---|---|---|---|
| Previous Owner | Conway Lorraine A | $405,600 | |
| Previous Owner | Buck Andrew W | $273,500 | |
| Previous Owner | Buck Andrew W | $225,000 |
Source: Public Records
Tax History
| Year | Tax Paid | Tax Assessment Tax Assessment Total Assessment is a certain percentage of the fair market value that is determined by local assessors to be the total taxable value of land and additions on the property. | Land | Improvement |
|---|---|---|---|---|
| 2025 | $10,512 | $922,900 | $499,000 | $423,900 |
| 2024 | $10,392 | $886,700 | $479,300 | $407,400 |
| 2023 | $10,072 | $800,000 | $432,200 | $367,800 |
| 2022 | $9,700 | $727,700 | $392,900 | $334,800 |
| 2021 | $23,785 | $703,500 | $376,500 | $327,000 |
| 2020 | $9,341 | $669,600 | $358,200 | $311,400 |
| 2019 | $9,080 | $638,100 | $341,200 | $296,900 |
| 2018 | $8,351 | $602,100 | $321,800 | $280,300 |
| 2017 | $7,973 | $602,100 | $321,800 | $280,300 |
| 2016 | $8,329 | $574,400 | $304,000 | $270,400 |
| 2015 | $7,810 | $531,300 | $281,000 | $250,300 |
| 2014 | $7,569 | $513,500 | $271,400 | $242,100 |
Source: Public Records
Map
Nearby Homes
- 90 Sunnyside Ave
- 5 Washington St Unit D4
- 5 Washington St Unit A5
- 20 Pinevale Ave
- 269 Main St Unit 4001
- 1 Pennsylvania Ave
- 241 Main St Unit C3
- 48 Village St Unit 1001
- 101 King St Unit 101
- 75 Hopkins St
- 133 Pine Ridge Rd
- 16 Munroe Ave
- 1014 Gazebo Cir Unit 1014
- 313 South St
- 44 Grandview Rd
- 311 Gazebo Cir Unit 311
- 1 Summit Dr Unit 57
- 141 Belmont St
- 41 Winter St
- 75 Augustus Ct Unit 2003
- 49 Riverside Dr
- 59 Riverside Dr
- 63 Riverside Dr
- 47 Warren Ave
- 43 Riverside Dr
- 58 Riverside Dr
- 52 Riverside Dr
- 41 Warren Ave
- 39 Riverside Dr
- 67 Riverside Dr
- 64 Riverside Dr
- 37 Warren Ave
- 72 Fairview Ave
- 68 Riverside Dr
- 35 Riverside Dr
- 71 Riverside Dr
- 42 Riverside Dr
- 38 Warren Ave
- 74 Riverside Dr
- 48 Warren Ave
Your Personal Tour Guide
Ask me questions while you tour the home.