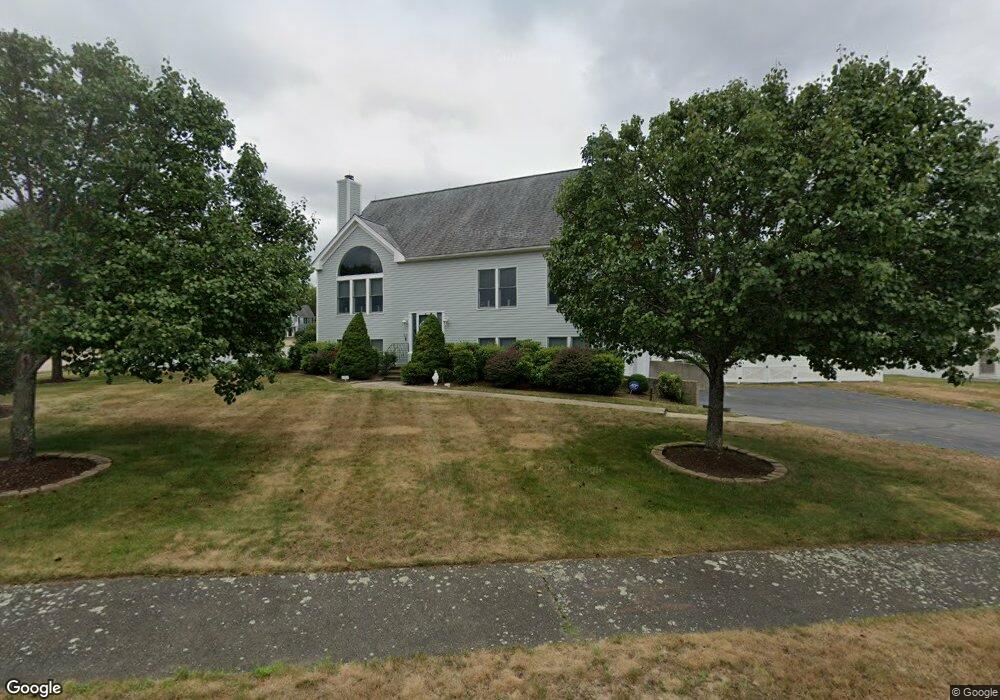
53 Robinette Rd Stoughton, MA 02072
Estimated Value: $820,630 - $966,000
4
Beds
3
Baths
2,691
Sq Ft
$328/Sq Ft
Est. Value
About This Home
This home is located at 53 Robinette Rd, Stoughton, MA 02072 and is currently estimated at $882,658, approximately $328 per square foot. 53 Robinette Rd is a home located in Norfolk County with nearby schools including Helen Hansen Elementary School, Dr. Robert G. O'Donnell Middle School, and Stoughton High School.
Ownership History
Date
Name
Owned For
Owner Type
Purchase Details
Closed on
Oct 15, 2021
Sold by
Ferrera Karen M
Bought by
Karen M Ferrera Ret and Ferrera
Current Estimated Value
Purchase Details
Closed on
Mar 31, 2004
Sold by
Nolan John J and Nolan Karen M
Bought by
Ferrera Karen M
Purchase Details
Closed on
Dec 2, 1992
Sold by
Hanson Landing Corp
Bought by
Nolan John J and Nolan Karen M
Home Financials for this Owner
Home Financials are based on the most recent Mortgage that was taken out on this home.
Original Mortgage
$190,000
Interest Rate
8.22%
Mortgage Type
Purchase Money Mortgage
Create a Home Valuation Report for This Property
The Home Valuation Report is an in-depth analysis detailing your home's value as well as a comparison with similar homes in the area
Home Values in the Area
Average Home Value in this Area
Purchase History
| Date | Buyer | Sale Price | Title Company |
|---|---|---|---|
| Karen M Ferrera Ret | -- | None Available | |
| Karen M Ferrera Ret | -- | None Available | |
| Karen M Ferrera Ret | -- | None Available | |
| Ferrera Karen M | -- | -- | |
| Ferrera Karen M | -- | -- | |
| Nolan John J | $192,375 | -- | |
| Nolan John J | $192,375 | -- |
Source: Public Records
Mortgage History
| Date | Status | Borrower | Loan Amount |
|---|---|---|---|
| Previous Owner | Nolan John J | $162,000 | |
| Previous Owner | Nolan John J | $190,000 |
Source: Public Records
Tax History Compared to Growth
Tax History
| Year | Tax Paid | Tax Assessment Tax Assessment Total Assessment is a certain percentage of the fair market value that is determined by local assessors to be the total taxable value of land and additions on the property. | Land | Improvement |
|---|---|---|---|---|
| 2025 | $8,314 | $671,600 | $235,900 | $435,700 |
| 2024 | $8,085 | $635,100 | $225,100 | $410,000 |
| 2023 | $7,641 | $563,900 | $193,000 | $370,900 |
| 2022 | $7,179 | $498,200 | $168,000 | $330,200 |
| 2021 | $7,259 | $480,700 | $160,800 | $319,900 |
| 2020 | $7,158 | $480,700 | $160,800 | $319,900 |
| 2019 | $6,823 | $444,800 | $160,800 | $284,000 |
| 2018 | $6,641 | $448,400 | $164,400 | $284,000 |
| 2017 | $6,226 | $429,700 | $164,400 | $265,300 |
| 2016 | $5,892 | $393,600 | $160,800 | $232,800 |
| 2015 | $5,683 | $375,600 | $155,500 | $220,100 |
| 2014 | $5,411 | $343,800 | $135,800 | $208,000 |
Source: Public Records
Map
Nearby Homes