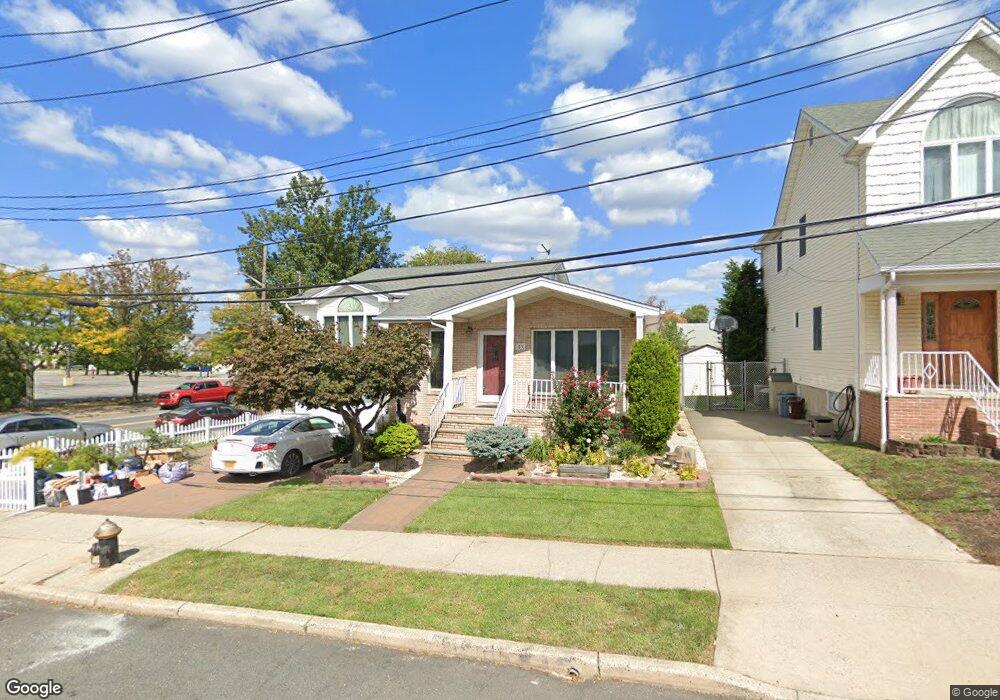
53 Ruth St Unit 55 Staten Island, NY 10314
Westerleigh NeighborhoodEstimated Value: $756,000 - $858,000
--
Bed
4
Baths
1,110
Sq Ft
$720/Sq Ft
Est. Value
About This Home
This home is located at 53 Ruth St Unit 55, Staten Island, NY 10314 and is currently estimated at $799,158, approximately $719 per square foot. 53 Ruth St Unit 55 is a home located in Richmond County with nearby schools including P.S. 30 Westerleigh, I.S. 51 Edwin Markham, and Port Richmond High School.
Ownership History
Date
Name
Owned For
Owner Type
Purchase Details
Closed on
Dec 13, 2019
Sold by
Mazza Kim E
Bought by
Mazza Glenn Vincent
Current Estimated Value
Home Financials for this Owner
Home Financials are based on the most recent Mortgage that was taken out on this home.
Original Mortgage
$390,000
Outstanding Balance
$343,841
Interest Rate
3.6%
Mortgage Type
New Conventional
Estimated Equity
$455,317
Purchase Details
Closed on
Dec 17, 2003
Sold by
Murray Brian and Murray Melissa
Bought by
Mazza Kim E and Derenzi Robert M
Home Financials for this Owner
Home Financials are based on the most recent Mortgage that was taken out on this home.
Original Mortgage
$295,000
Interest Rate
5.58%
Mortgage Type
Purchase Money Mortgage
Purchase Details
Closed on
Oct 26, 1995
Sold by
The City Of New York
Bought by
Murray Brian R and Murray Melissa
Create a Home Valuation Report for This Property
The Home Valuation Report is an in-depth analysis detailing your home's value as well as a comparison with similar homes in the area
Home Values in the Area
Average Home Value in this Area
Purchase History
| Date | Buyer | Sale Price | Title Company |
|---|---|---|---|
| Mazza Glenn Vincent | $600,000 | Arc Abstract Agency Llc | |
| Mazza Kim E | $565,000 | First American Title Insuran | |
| Murray Brian R | $500 | -- |
Source: Public Records
Mortgage History
| Date | Status | Borrower | Loan Amount |
|---|---|---|---|
| Open | Mazza Glenn Vincent | $390,000 | |
| Previous Owner | Mazza Kim E | $295,000 |
Source: Public Records
Tax History Compared to Growth
Tax History
| Year | Tax Paid | Tax Assessment Tax Assessment Total Assessment is a certain percentage of the fair market value that is determined by local assessors to be the total taxable value of land and additions on the property. | Land | Improvement |
|---|---|---|---|---|
| 2025 | $8,002 | $44,400 | $19,003 | $25,397 |
| 2024 | $8,002 | $44,760 | $17,783 | $26,977 |
| 2023 | $7,633 | $37,584 | $18,138 | $19,446 |
| 2022 | $7,115 | $35,640 | $19,980 | $15,660 |
| 2021 | $7,850 | $37,560 | $19,980 | $17,580 |
| 2020 | $7,449 | $37,380 | $19,980 | $17,400 |
| 2019 | $6,652 | $37,560 | $19,980 | $17,580 |
| 2018 | $6,087 | $31,320 | $19,980 | $11,340 |
| 2017 | $6,442 | $33,072 | $19,561 | $13,511 |
| 2016 | $5,927 | $31,200 | $19,980 | $11,220 |
| 2015 | -- | $29,760 | $18,300 | $11,460 |
| 2014 | -- | $28,876 | $17,721 | $11,155 |
Source: Public Records
Map
Nearby Homes
- 304 Livermore Ave
- 379 Woolley Ave
- 292 Woolley Ave
- 290 Woolley Ave
- 181 Collfield Ave
- 202 Watchogue Rd
- 279 Collfield Ave
- 26 Iowa Place
- 279 Saint John Ave
- 470 Livermore Ave
- 422 Crystal Ave
- 282 Willard Ave
- 63 Avon Ln
- 184 Dickie Ave
- 144 Bryson Ave
- 255 Caswell Ave
- 75 Muller Ave
- 307 Clinton B Fiske Ave
- 307 Fiske Ave
- 320 Bryson Ave
- 53-55 Ruth St
- 49 Ruth St
- 304 Watchogue Rd
- 300 Watchogue Rd
- 332 Livermore Ave
- 336 Livermore Ave
- 298 Watchogue Rd
- 296 Watchogue Rd
- 54 Ruth St
- 292 Watchogue Rd
- 50 Ruth St
- 350 Livermore Ave
- 290 Watchogue Rd
- 352 Livermore Ave
- 330 Watchogue Rd
- 353 Woolley Ave
- 356 Livermore Ave
- 299 Watchogue Rd
- 357 Woolley Ave
- 295 Watchogue Rd