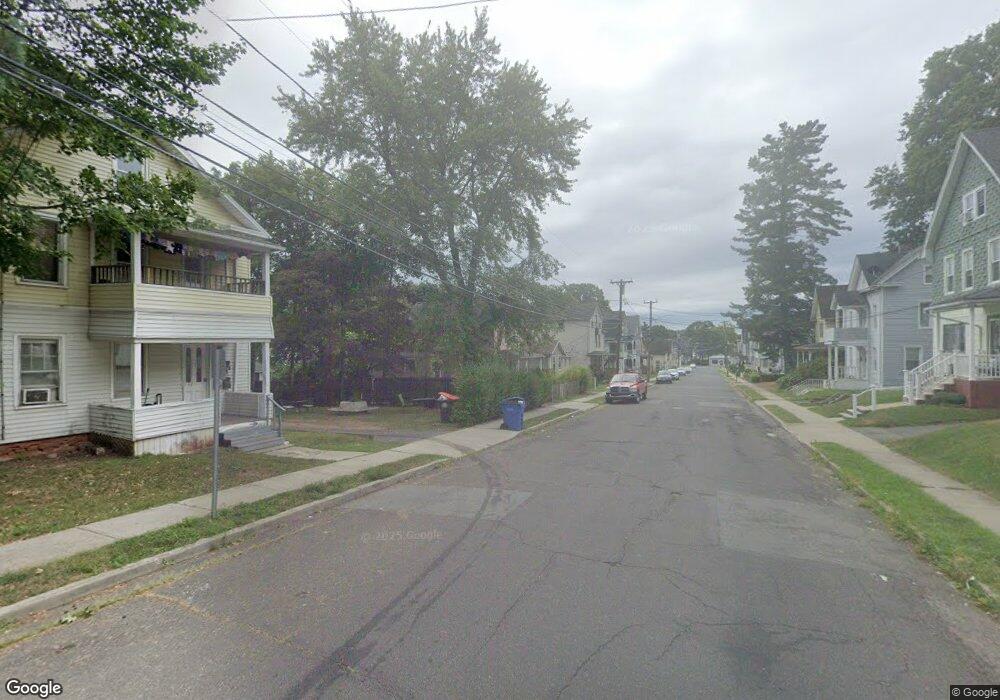
53 S 3rd St Meriden, CT 06451
Estimated Value: $174,000 - $239,000
2
Beds
1
Bath
867
Sq Ft
$248/Sq Ft
Est. Value
About This Home
This home is located at 53 S 3rd St, Meriden, CT 06451 and is currently estimated at $215,029, approximately $248 per square foot. 53 S 3rd St is a home located in New Haven County with nearby schools including Casimir Pulaski School, Lincoln Middle School, and Orville H. Platt High School.
Ownership History
Date
Name
Owned For
Owner Type
Purchase Details
Closed on
Aug 6, 2010
Sold by
Department Of Housing & Urban Dev
Bought by
Gonzalez Oscar
Current Estimated Value
Purchase Details
Closed on
Mar 24, 2010
Sold by
Chase Home Finance Llc
Bought by
Department Of Housing & Urban Dev
Purchase Details
Closed on
Dec 30, 2009
Sold by
Gonzalez Miguel A
Bought by
Chase Home Finance Llc
Purchase Details
Closed on
Dec 1, 2000
Sold by
Stonegate Prop Mgm Llc
Bought by
Gonzalez Miguel A
Purchase Details
Closed on
Nov 1, 2000
Sold by
Department Of Housing & Urban Dev
Bought by
Nagelucci Todd
Purchase Details
Closed on
Apr 22, 1999
Sold by
Chase Manhattan Mtg Co
Bought by
Department Of Housing & Urban Dev
Purchase Details
Closed on
Dec 13, 1991
Sold by
Fernandez Betty M Est
Bought by
Antonelli Frank A and Antonelli Ada
Create a Home Valuation Report for This Property
The Home Valuation Report is an in-depth analysis detailing your home's value as well as a comparison with similar homes in the area
Home Values in the Area
Average Home Value in this Area
Purchase History
| Date | Buyer | Sale Price | Title Company |
|---|---|---|---|
| Gonzalez Oscar | $35,000 | -- | |
| Department Of Housing & Urban Dev | -- | -- | |
| Chase Home Finance Llc | -- | -- | |
| Gonzalez Miguel A | $69,900 | -- | |
| Nagelucci Todd | $28,500 | -- | |
| Department Of Housing & Urban Dev | $68,391 | -- | |
| Antonelli Frank A | $70,000 | -- |
Source: Public Records
Mortgage History
| Date | Status | Borrower | Loan Amount |
|---|---|---|---|
| Closed | Antonelli Frank A | $25,000 | |
| Previous Owner | Antonelli Frank A | $182,700 |
Source: Public Records
Tax History
| Year | Tax Paid | Tax Assessment Tax Assessment Total Assessment is a certain percentage of the fair market value that is determined by local assessors to be the total taxable value of land and additions on the property. | Land | Improvement |
|---|---|---|---|---|
| 2025 | $3,529 | $93,100 | $32,060 | $61,040 |
| 2024 | $3,585 | $93,100 | $32,060 | $61,040 |
| 2023 | $3,456 | $93,100 | $32,060 | $61,040 |
| 2022 | $3,260 | $93,100 | $32,060 | $61,040 |
| 2021 | $2,870 | $65,940 | $27,440 | $38,500 |
| 2020 | $2,862 | $65,940 | $27,440 | $38,500 |
| 2019 | $2,838 | $65,940 | $27,440 | $38,500 |
| 2018 | $2,849 | $65,940 | $27,440 | $38,500 |
| 2017 | $2,773 | $65,940 | $27,440 | $38,500 |
| 2016 | $2,727 | $70,560 | $26,040 | $44,520 |
| 2015 | $2,727 | $70,350 | $25,830 | $44,520 |
| 2014 | $2,661 | $70,350 | $25,830 | $44,520 |
Source: Public Records
Map
Nearby Homes
- 66 S 3rd St
- 56 N First St
- 86 Linsley Ave
- 41 Park Place
- 44 4th St
- 23 N 1st St
- 61 Randolph Ave
- 74 Randolph Ave
- 16 Park Place
- 236 W Main St
- 230 W Main St
- 127 Lambert Ave
- 76 Columbus Ave
- 55 Lewis Ave
- 31 Winthrop St
- 60 Capitol Ave
- 14 North St
- 185 Carter Avenue Extension
- 33 W Main St Unit 16
- 33 W Main St Unit 1
Your Personal Tour Guide
Ask me questions while you tour the home.