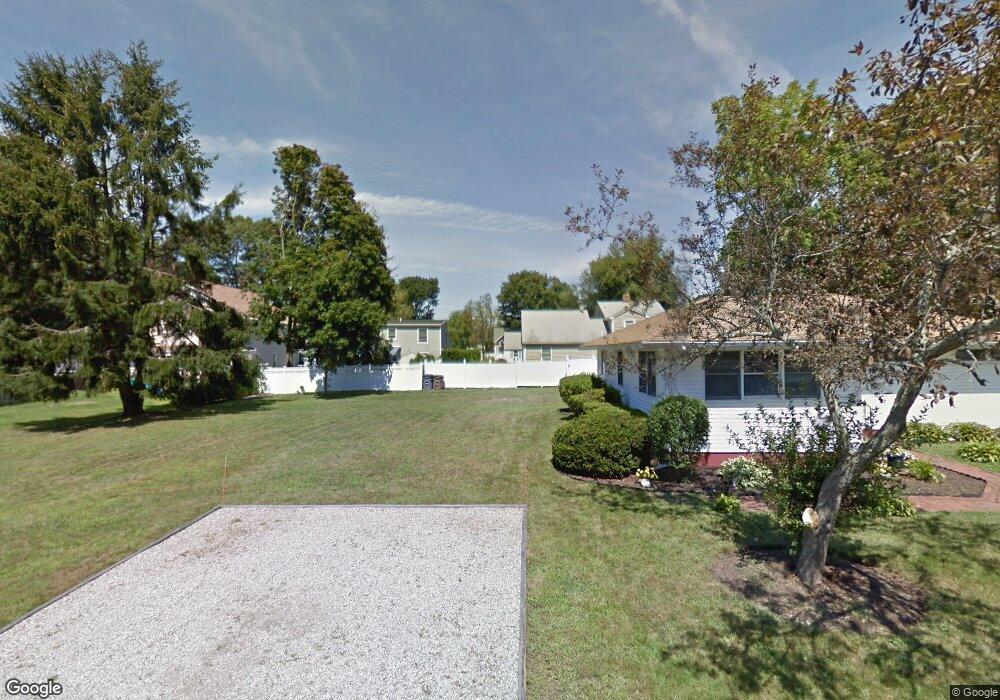
53 Sea View Ave Niantic, CT 06357
Estimated Value: $636,000 - $1,057,000
3
Beds
2
Baths
2,539
Sq Ft
$326/Sq Ft
Est. Value
About This Home
This home is located at 53 Sea View Ave, Niantic, CT 06357 and is currently estimated at $826,763, approximately $325 per square foot. 53 Sea View Ave is a home located in New London County with nearby schools including East Lyme Middle School, East Lyme High School, and The Light House Voc-Ed Center.
Ownership History
Date
Name
Owned For
Owner Type
Purchase Details
Closed on
Apr 30, 2015
Sold by
Chavez Daisy
Bought by
Lee Peter B and Simoni Dana
Current Estimated Value
Home Financials for this Owner
Home Financials are based on the most recent Mortgage that was taken out on this home.
Original Mortgage
$240,000
Interest Rate
3.76%
Mortgage Type
New Conventional
Create a Home Valuation Report for This Property
The Home Valuation Report is an in-depth analysis detailing your home's value as well as a comparison with similar homes in the area
Home Values in the Area
Average Home Value in this Area
Purchase History
| Date | Buyer | Sale Price | Title Company |
|---|---|---|---|
| Lee Peter B | $300,000 | -- | |
| Lee Peter B | $300,000 | -- |
Source: Public Records
Mortgage History
| Date | Status | Borrower | Loan Amount |
|---|---|---|---|
| Open | Lee Peter B | $80,000 | |
| Open | Lee Peter B | $237,000 | |
| Closed | Lee Peter B | $240,000 |
Source: Public Records
Tax History
| Year | Tax Paid | Tax Assessment Tax Assessment Total Assessment is a certain percentage of the fair market value that is determined by local assessors to be the total taxable value of land and additions on the property. | Land | Improvement |
|---|---|---|---|---|
| 2025 | $11,535 | $411,810 | $121,100 | $290,710 |
| 2024 | $10,851 | $411,810 | $121,100 | $290,710 |
| 2023 | $10,246 | $411,810 | $121,100 | $290,710 |
| 2022 | $9,818 | $411,810 | $121,100 | $290,710 |
| 2021 | $8,069 | $283,010 | $104,930 | $178,080 |
| 2020 | $8,024 | $282,940 | $104,930 | $178,010 |
| 2019 | $7,976 | $282,940 | $104,930 | $178,010 |
| 2018 | $7,738 | $282,940 | $104,930 | $178,010 |
| 2017 | $7,402 | $282,940 | $104,930 | $178,010 |
| 2016 | $4,012 | $158,200 | $104,930 | $53,270 |
| 2015 | $3,909 | $158,200 | $104,930 | $53,270 |
| 2014 | -- | $158,200 | $104,930 | $53,270 |
Source: Public Records
Map
Nearby Homes
- 54 Sea Crest Ave
- 61 Whitecap Rd
- 13 Park Ct
- 36 Attawan Rd
- 26 Mohawk Dr
- 15 Griswold Rd
- 127 Black Point Rd Unit 7
- 23 Central Ave
- 53 Laurelwood Dr Unit 55
- 19 Sapia Dr
- 6 Slocum Dr
- 15 Sunnieside Dr
- 12 Spinnaker Dr
- 86 Corey Ln
- 9 Columbus Ave
- 468 Main St Unit 318
- 468 Main St Unit 111
- 47 Village Crossing Unit 47
- 46 Village Crossing Unit 46
- 97 W Main St Unit 36
- 51 Sea View Ave
- 50 Sea Breeze Ave
- 48 Sea Breeze Ave
- 52 Sea Breeze Ave
- 54 Sea View Ave
- 56 Sea View Ave
- 61 Sea View Ave
- 44 Sea Breeze Ave
- 58 Sea View Ave
- 49 Sea View Ave
- 36 Sunset Ave
- 60 Sea View Ave
- 42 Sea Breeze Ave
- 61 Sea Crest Ave
- 49 Sea Breeze Ave
- 47 Sea Breeze Ave
- 59 Sea Crest Ave
- 46 Sea View Ave
- 65 Sea Crest Ave
- 53 Sea Breeze Ave
Your Personal Tour Guide
Ask me questions while you tour the home.