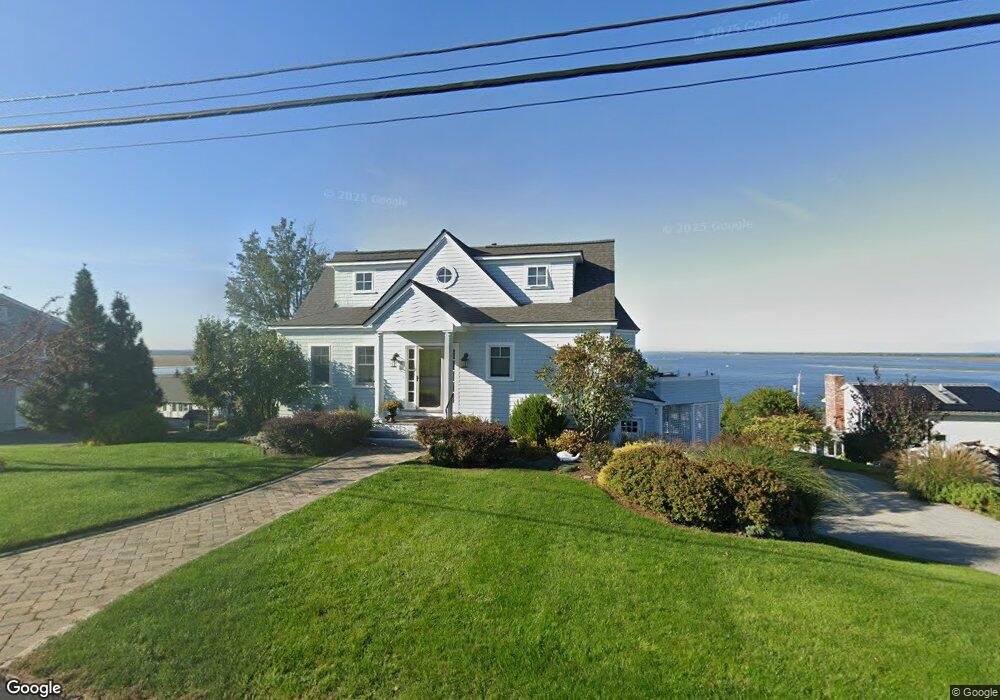
53 Skytop Rd Ipswich, MA 01938
Estimated Value: $1,336,000 - $1,588,000
2
Beds
4
Baths
2,146
Sq Ft
$690/Sq Ft
Est. Value
About This Home
This home is located at 53 Skytop Rd, Ipswich, MA 01938 and is currently estimated at $1,481,798, approximately $690 per square foot. 53 Skytop Rd is a home located in Essex County with nearby schools including Ipswich High School.
Ownership History
Date
Name
Owned For
Owner Type
Purchase Details
Closed on
Jun 3, 2025
Sold by
Ohara Marcia E
Bought by
Ohara 2005 Rt and Ohara
Current Estimated Value
Purchase Details
Closed on
Jan 13, 2011
Sold by
Ohara Rt
Bought by
Ohara Marcia E
Home Financials for this Owner
Home Financials are based on the most recent Mortgage that was taken out on this home.
Original Mortgage
$252,950
Interest Rate
4.75%
Purchase Details
Closed on
Sep 17, 2004
Sold by
Ohara 2002 Rt
Bought by
Ohara Marcia E
Purchase Details
Closed on
Sep 3, 2003
Sold by
Ohara Marcia E and Ohara Mark S
Bought by
Ohara 2002 Rt
Purchase Details
Closed on
Apr 4, 2002
Sold by
Senechal Roland N and Senechal Joanne D
Bought by
Ohara Mark S and Ohara Marcia E
Create a Home Valuation Report for This Property
The Home Valuation Report is an in-depth analysis detailing your home's value as well as a comparison with similar homes in the area
Home Values in the Area
Average Home Value in this Area
Purchase History
| Date | Buyer | Sale Price | Title Company |
|---|---|---|---|
| Ohara 2005 Rt | -- | None Available | |
| Ohara 2005 Rt | -- | None Available | |
| Ohara Marcia E | -- | -- | |
| Ohara Marcia E | -- | -- | |
| Ohara Marcia E | -- | -- | |
| Ohara Marcia E | -- | -- | |
| Ohara 2002 Rt | -- | -- | |
| Ohara 2002 Rt | -- | -- | |
| Ohara Mark S | $409,000 | -- | |
| Ohara Mark S | $409,000 | -- |
Source: Public Records
Mortgage History
| Date | Status | Borrower | Loan Amount |
|---|---|---|---|
| Previous Owner | Ohara Mark S | $252,950 |
Source: Public Records
Tax History Compared to Growth
Tax History
| Year | Tax Paid | Tax Assessment Tax Assessment Total Assessment is a certain percentage of the fair market value that is determined by local assessors to be the total taxable value of land and additions on the property. | Land | Improvement |
|---|---|---|---|---|
| 2025 | $14,173 | $1,271,100 | $752,700 | $518,400 |
| 2024 | $15,479 | $1,360,200 | $754,000 | $606,200 |
| 2023 | $15,569 | $1,273,000 | $736,900 | $536,100 |
| 2022 | $10,949 | $851,400 | $366,700 | $484,700 |
| 2021 | $10,535 | $796,900 | $342,700 | $454,200 |
| 2020 | $10,487 | $748,000 | $335,900 | $412,100 |
| 2019 | $10,327 | $732,900 | $335,900 | $397,000 |
| 2018 | $9,924 | $696,900 | $299,900 | $397,000 |
| 2017 | $9,564 | $674,000 | $291,300 | $382,700 |
| 2016 | $9,664 | $650,800 | $281,000 | $369,800 |
| 2015 | $8,817 | $652,600 | $282,800 | $369,800 |
Source: Public Records
Map
Nearby Homes
- 8 Goldfinch Way
- 63 N Ridge Rd
- 18 Northridge Rd
- 4 N Ridge Rd
- 143 Jeffreys Neck Rd
- 22 Little Neck Rd
- 23 Mulholland Dr
- 15 Eagle Hill Rd
- 113 N Ridge Rd
- 123 Jeffreys Neck Rd
- 23 Jeffrey's Neck Rd
- 50 Jeffreys Neck Rd
- 3 Jeffreys Neck Rd
- 23 Newmarch St
- 11 Spillers Ln
- 4 Agawam Ave
- 7 Highland Ave Unit 9
- 20 Summer St Unit 20
- 54 N Main St
- 29 Summer St Unit 15