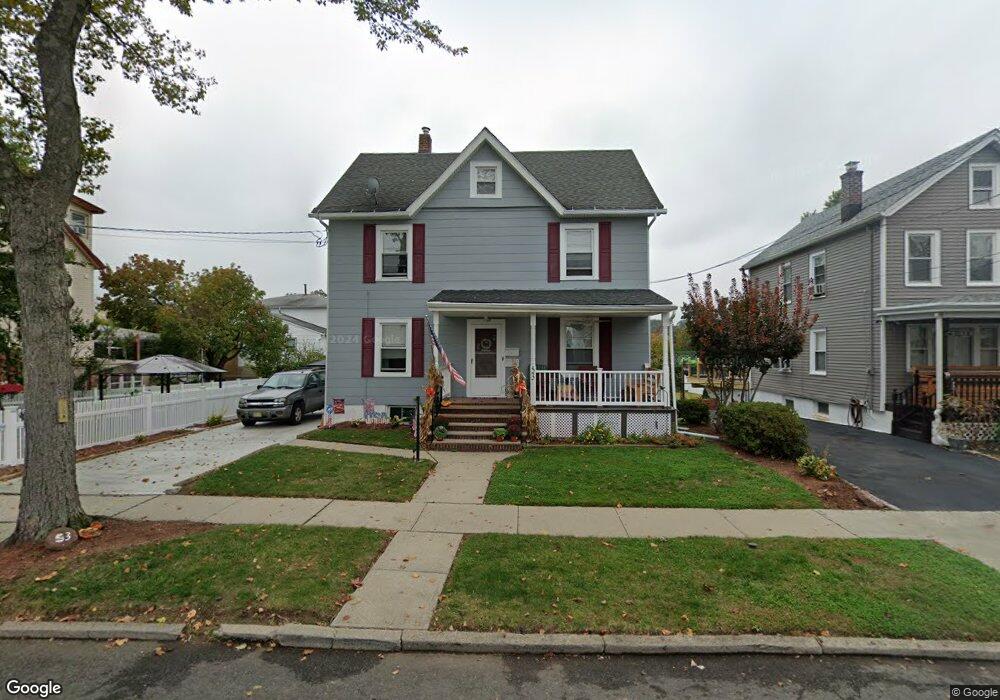
53 Spring St Bloomfield, NJ 07003
Estimated Value: $509,725 - $724,000
Studio
--
Bath
1,709
Sq Ft
$375/Sq Ft
Est. Value
About This Home
This home is located at 53 Spring St, Bloomfield, NJ 07003 and is currently estimated at $641,431, approximately $375 per square foot. 53 Spring St is a home located in Essex County with nearby schools including Franklin School, Bloomfield Middle School, and Bloomfield High School.
Ownership History
Date
Name
Owned For
Owner Type
Purchase Details
Closed on
May 14, 2008
Sold by
Henecker Brian and Henecker Judith
Bought by
Henecker Brian and Henecker Judith
Current Estimated Value
Home Financials for this Owner
Home Financials are based on the most recent Mortgage that was taken out on this home.
Original Mortgage
$313,600
Outstanding Balance
$200,978
Interest Rate
6.11%
Mortgage Type
New Conventional
Estimated Equity
$440,453
Purchase Details
Closed on
Jun 12, 1997
Sold by
Sowa Christopher
Bought by
Ramirez Jose and Ramirez Judith
Home Financials for this Owner
Home Financials are based on the most recent Mortgage that was taken out on this home.
Original Mortgage
$123,000
Interest Rate
7.86%
Purchase Details
Closed on
Jan 24, 1989
Sold by
Sowa Christopher J and Sowa Garrity,K M
Bought by
Sowa Christopher J and Sowa Kathleen M
Create a Home Valuation Report for This Property
The Home Valuation Report is an in-depth analysis detailing your home's value as well as a comparison with similar homes in the area
Home Values in the Area
Average Home Value in this Area
Purchase History
| Date | Buyer | Sale Price | Title Company |
|---|---|---|---|
| Henecker Brian | -- | Zinn Title Agency Llc | |
| Ramirez Jose | $143,000 | -- | |
| Sowa Christopher J | -- | -- |
Source: Public Records
Mortgage History
| Date | Status | Borrower | Loan Amount |
|---|---|---|---|
| Open | Henecker Brian | $313,600 | |
| Closed | Ramirez Jose | $123,000 |
Source: Public Records
Tax History
| Year | Tax Paid | Tax Assessment Tax Assessment Total Assessment is a certain percentage of the fair market value that is determined by local assessors to be the total taxable value of land and additions on the property. | Land | Improvement |
|---|---|---|---|---|
| 2025 | $10,285 | $303,200 | $135,500 | $167,700 |
| 2024 | $9,909 | $303,200 | $135,500 | $167,700 |
| 2022 | $9,530 | $303,200 | $135,500 | $167,700 |
| 2021 | $9,530 | $303,200 | $135,500 | $167,700 |
| 2020 | $9,384 | $303,200 | $135,500 | $167,700 |
| 2019 | $10,514 | $264,100 | $136,800 | $127,300 |
| 2018 | $10,316 | $264,100 | $136,800 | $127,300 |
| 2017 | $10,287 | $264,100 | $136,800 | $127,300 |
| 2016 | $10,194 | $264,100 | $136,800 | $127,300 |
| 2015 | $10,102 | $264,100 | $136,800 | $127,300 |
| 2014 | $9,917 | $264,100 | $136,800 | $127,300 |
Source: Public Records
Map
Nearby Homes
- 7 Maple St
- 10 Almira St Unit 14
- 10 14almira St
- 10 E Passaic Ave
- 46 Maple St
- 46 Summit Ave
- 58 Osborne St
- 28 Forest Dr
- 39 Forest Dr
- 378 Hoover Ave Unit 149
- 185 State St
- 366 Hoover Ave Unit 119
- 82 Essex Ave
- 41 Woodland Rd
- 39 Woodland Rd
- 152 Belleville Ave Unit 1
- 5 Woodland Rd
- 115 Spruce St
- 186 Walnut St Unit 114
- 169 Walnut St
Your Personal Tour Guide
Ask me questions while you tour the home.