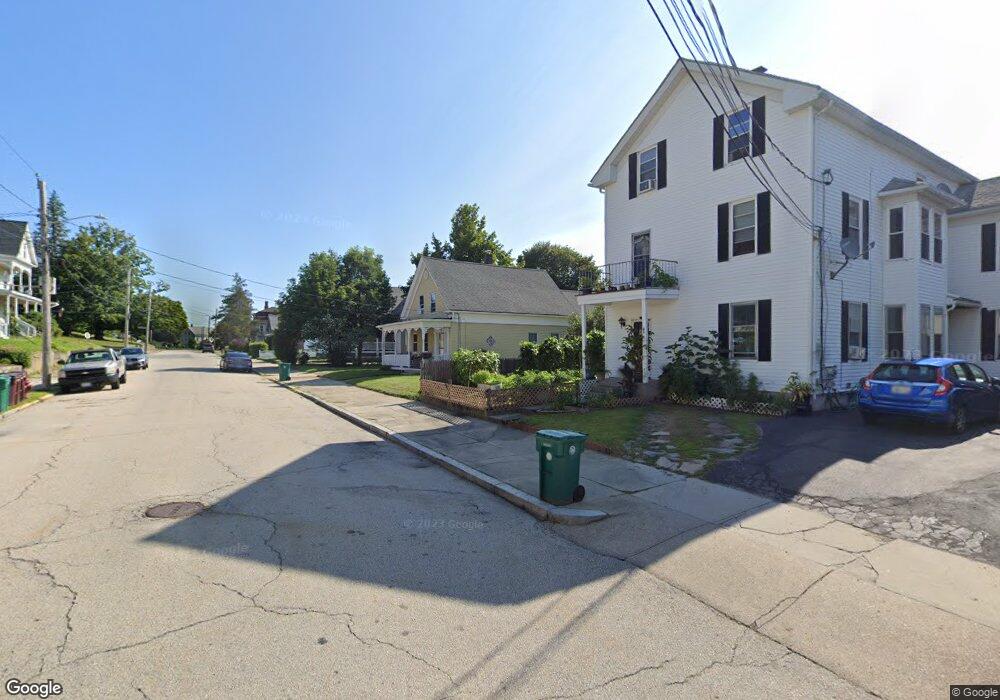
53 Spring St Woonsocket, RI 02895
North End NeighborhoodEstimated Value: $353,000 - $426,000
3
Beds
2
Baths
1,596
Sq Ft
$244/Sq Ft
Est. Value
About This Home
This home is located at 53 Spring St, Woonsocket, RI 02895 and is currently estimated at $389,791, approximately $244 per square foot. 53 Spring St is a home located in Providence County with nearby schools including Woonsocket High School, Rise Prep Mayoral Academy Middle School, and Rise Prep Mayoral Academy.
Ownership History
Date
Name
Owned For
Owner Type
Purchase Details
Closed on
Mar 1, 1994
Sold by
Descy Claire and Pereshula Genevieve
Bought by
Gravel John P and Gravel Dolores
Current Estimated Value
Home Financials for this Owner
Home Financials are based on the most recent Mortgage that was taken out on this home.
Original Mortgage
$77,900
Interest Rate
6.96%
Create a Home Valuation Report for This Property
The Home Valuation Report is an in-depth analysis detailing your home's value as well as a comparison with similar homes in the area
Home Values in the Area
Average Home Value in this Area
Purchase History
| Date | Buyer | Sale Price | Title Company |
|---|---|---|---|
| Gravel John P | $82,000 | -- | |
| Gravel John P | $82,000 | -- |
Source: Public Records
Mortgage History
| Date | Status | Borrower | Loan Amount |
|---|---|---|---|
| Open | Gravel John P | $80,000 | |
| Closed | Gravel John P | $77,900 |
Source: Public Records
Tax History
| Year | Tax Paid | Tax Assessment Tax Assessment Total Assessment is a certain percentage of the fair market value that is determined by local assessors to be the total taxable value of land and additions on the property. | Land | Improvement |
|---|---|---|---|---|
| 2025 | $3,518 | $313,300 | $98,900 | $214,400 |
| 2024 | $3,545 | $243,800 | $93,900 | $149,900 |
| 2023 | $3,408 | $243,800 | $93,900 | $149,900 |
| 2022 | $3,408 | $243,800 | $93,900 | $149,900 |
| 2021 | $3,743 | $157,600 | $61,500 | $96,100 |
| 2020 | $3,782 | $157,600 | $61,500 | $96,100 |
| 2018 | $3,795 | $157,600 | $61,500 | $96,100 |
| 2017 | $4,100 | $136,200 | $55,200 | $81,000 |
| 2016 | $4,337 | $136,200 | $55,200 | $81,000 |
| 2015 | $4,982 | $136,200 | $55,200 | $81,000 |
| 2014 | $3,369 | $133,900 | $60,700 | $73,200 |
Source: Public Records
Map
Nearby Homes
- 187 Boyden St
- 58 Oakley Rd
- 83 Summer St
- 0 N Main St Unit 1401765
- 115 Railroad St
- 308 Harris Ave
- 437 N Main St
- 56 Winter St
- 130 E School St
- 36 Fairmount St
- 458 Prospect St
- 99 Allen St Unit 205
- 148 Bernon St Unit 26
- 542 Prospect St
- 35 Greene St
- 589 Gaskill St
- 70 W Park Place
- 60 Fairlawn Ave
- 379 Front St
- 42 Elbow St
Your Personal Tour Guide
Ask me questions while you tour the home.