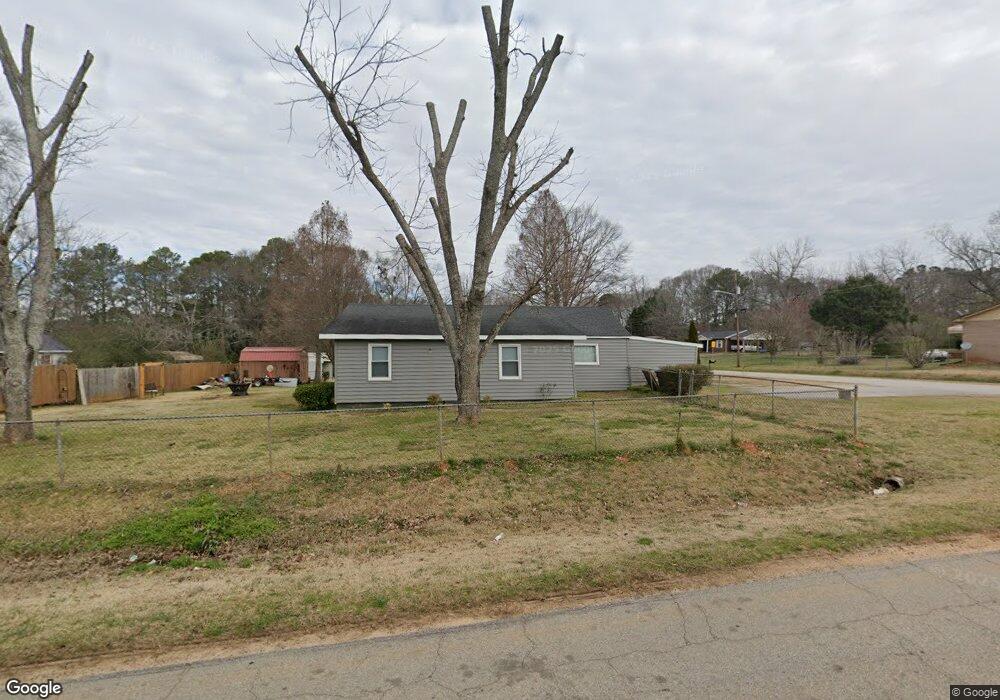
53 Swint Rd Griffin, GA 30224
Spalding County NeighborhoodEstimated Value: $155,766 - $205,000
5
Beds
1
Bath
1,382
Sq Ft
$131/Sq Ft
Est. Value
About This Home
This home is located at 53 Swint Rd, Griffin, GA 30224 and is currently estimated at $180,692, approximately $130 per square foot. 53 Swint Rd is a home located in Spalding County with nearby schools including Futral Road Elementary School, Rehoboth Road Middle School, and Spalding High School.
Ownership History
Date
Name
Owned For
Owner Type
Purchase Details
Closed on
Jul 7, 2021
Sold by
Vaughn Viola B
Bought by
Vaughn William
Current Estimated Value
Home Financials for this Owner
Home Financials are based on the most recent Mortgage that was taken out on this home.
Original Mortgage
$95,000
Outstanding Balance
$86,091
Interest Rate
2.96%
Mortgage Type
New Conventional
Estimated Equity
$94,601
Purchase Details
Closed on
Aug 3, 2001
Sold by
Vaughan Viola B
Bought by
Bennett Aldine
Home Financials for this Owner
Home Financials are based on the most recent Mortgage that was taken out on this home.
Original Mortgage
$48,300
Interest Rate
7.1%
Mortgage Type
New Conventional
Purchase Details
Closed on
Apr 16, 2001
Sold by
Swint Roger H
Bought by
Swint Elizabeth T
Purchase Details
Closed on
Jun 24, 1988
Sold by
Hubbard L A Estate
Bought by
Hubbard Linnie P
Purchase Details
Closed on
Nov 8, 1958
Bought by
Hubbard L A
Create a Home Valuation Report for This Property
The Home Valuation Report is an in-depth analysis detailing your home's value as well as a comparison with similar homes in the area
Home Values in the Area
Average Home Value in this Area
Purchase History
| Date | Buyer | Sale Price | Title Company |
|---|---|---|---|
| Vaughn William | $100,000 | -- | |
| Bennett Aldine | -- | -- | |
| Swint Elizabeth T | -- | -- | |
| Hubbard Linnie P | -- | -- | |
| Hubbard L A | $5,000 | -- |
Source: Public Records
Mortgage History
| Date | Status | Borrower | Loan Amount |
|---|---|---|---|
| Open | Vaughn William | $95,000 | |
| Previous Owner | Bennett Aldine | $48,300 |
Source: Public Records
Tax History Compared to Growth
Tax History
| Year | Tax Paid | Tax Assessment Tax Assessment Total Assessment is a certain percentage of the fair market value that is determined by local assessors to be the total taxable value of land and additions on the property. | Land | Improvement |
|---|---|---|---|---|
| 2024 | $1,514 | $41,100 | $3,996 | $37,104 |
| 2023 | $1,540 | $38,685 | $3,996 | $34,689 |
| 2022 | $1,311 | $35,779 | $3,330 | $32,449 |
| 2021 | $664 | $18,959 | $3,330 | $15,629 |
| 2020 | $664 | $18,959 | $3,330 | $15,629 |
| 2019 | $676 | $18,959 | $3,330 | $15,629 |
| 2018 | $652 | $17,780 | $3,330 | $14,450 |
| 2017 | $635 | $17,780 | $3,330 | $14,450 |
| 2016 | $652 | $17,780 | $3,330 | $14,450 |
| 2015 | $661 | $17,780 | $3,330 | $14,450 |
| 2014 | $674 | $17,780 | $3,330 | $14,450 |
Source: Public Records
Map
Nearby Homes
- 2173 S Mcdonough Rd
- 1887 Green Valley Rd
- 1250 County Line Rd
- 1693 S Mcdonough Rd
- 25 Quail Hollow Rd
- 93 Green Acres Rd
- 55 Partridge Path
- 676 Lake Park North Dr
- 1967 Futral Rd
- 1050 County Line Rd Unit 10.75AC
- 1226 Knowles Aly
- 850 County Line Rd
- 131 Townsend Ct
- 137 Townsend Ct
- 529 Knollwood
- 100 Glenview Dr
- 3045 Sarah Ln
- 3028 Sarah Ln
- 321 Ridgeway Rd
- 3020 Sarah Ln