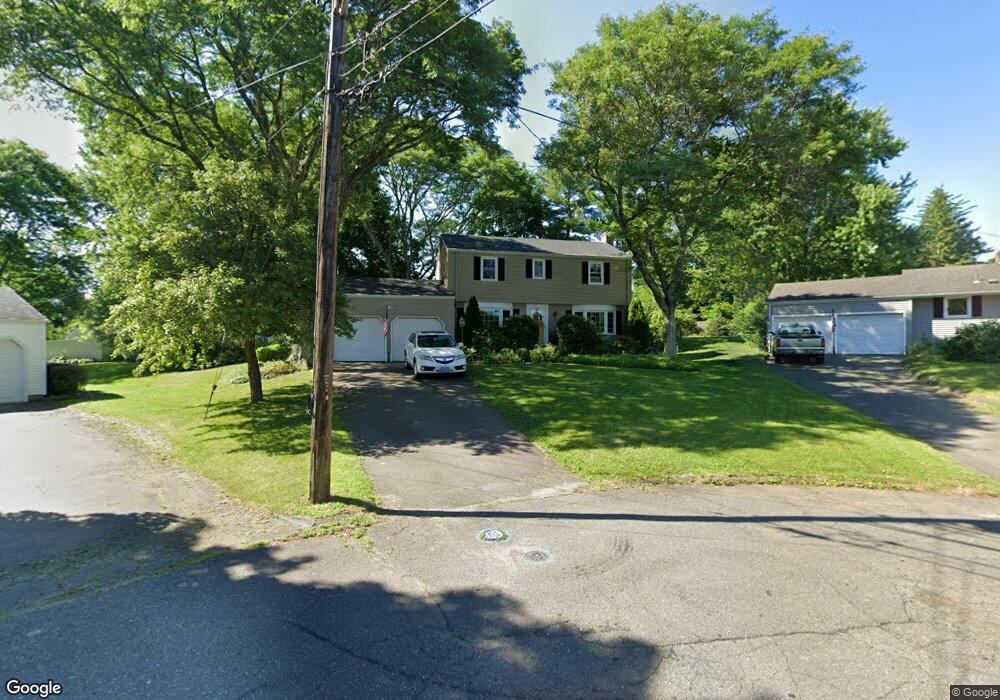
53 Terrace Rd Wethersfield, CT 06109
Estimated Value: $444,000 - $483,000
4
Beds
2
Baths
1,898
Sq Ft
$242/Sq Ft
Est. Value
About This Home
This home is located at 53 Terrace Rd, Wethersfield, CT 06109 and is currently estimated at $459,364, approximately $242 per square foot. 53 Terrace Rd is a home located in Hartford County with nearby schools including Emerson-Williams School, Silas Deane Middle School, and Wethersfield High School.
Ownership History
Date
Name
Owned For
Owner Type
Purchase Details
Closed on
Nov 17, 1997
Sold by
Wariner Wayne J and Wariner Shirley T
Bought by
Hollings John A and Hollings Lori H
Current Estimated Value
Home Financials for this Owner
Home Financials are based on the most recent Mortgage that was taken out on this home.
Original Mortgage
$160,550
Interest Rate
7.23%
Mortgage Type
Unknown
Create a Home Valuation Report for This Property
The Home Valuation Report is an in-depth analysis detailing your home's value as well as a comparison with similar homes in the area
Home Values in the Area
Average Home Value in this Area
Purchase History
| Date | Buyer | Sale Price | Title Company |
|---|---|---|---|
| Hollings John A | $169,000 | -- |
Source: Public Records
Mortgage History
| Date | Status | Borrower | Loan Amount |
|---|---|---|---|
| Closed | Hollings John A | $150,611 | |
| Closed | Hollings John A | $160,000 | |
| Closed | Hollings John A | $160,550 | |
| Previous Owner | Hollings John A | $100,000 |
Source: Public Records
Tax History
| Year | Tax Paid | Tax Assessment Tax Assessment Total Assessment is a certain percentage of the fair market value that is determined by local assessors to be the total taxable value of land and additions on the property. | Land | Improvement |
|---|---|---|---|---|
| 2025 | $11,614 | $281,760 | $94,740 | $187,020 |
| 2024 | $8,216 | $190,100 | $73,500 | $116,600 |
| 2023 | $7,942 | $190,100 | $73,500 | $116,600 |
| 2022 | $7,809 | $190,100 | $73,500 | $116,600 |
| 2021 | $7,731 | $190,100 | $73,500 | $116,600 |
| 2020 | $7,735 | $190,100 | $73,500 | $116,600 |
| 2019 | $7,745 | $190,100 | $73,500 | $116,600 |
| 2018 | $7,442 | $182,500 | $71,500 | $111,000 |
| 2017 | $7,258 | $182,500 | $71,500 | $111,000 |
| 2016 | $7,034 | $182,500 | $71,500 | $111,000 |
| 2015 | $6,931 | $181,500 | $71,500 | $110,000 |
| 2014 | $6,668 | $181,500 | $71,500 | $110,000 |
Source: Public Records
Map
Nearby Homes
- 89 Merriman Rd
- 455 Brimfield Rd
- 137 Dale Rd
- 38 Wheeler Rd
- 104 Willow St
- 0 Collier Rd
- 116 Wells Farm Dr
- 101 Collier Rd
- 119 Coleman Rd
- 108 Chamberlain Rd
- 35 Stillwold Dr
- 7 Barrington Dr Unit C
- 5 Robeth Ln
- 20 Forest Dr
- 195 Middletown Ave
- 47 Forest Dr
- 91 Somerset St
- 87 Somerset St
- 508 Highland St
- 268 Fox Hill Rd
Your Personal Tour Guide
Ask me questions while you tour the home.