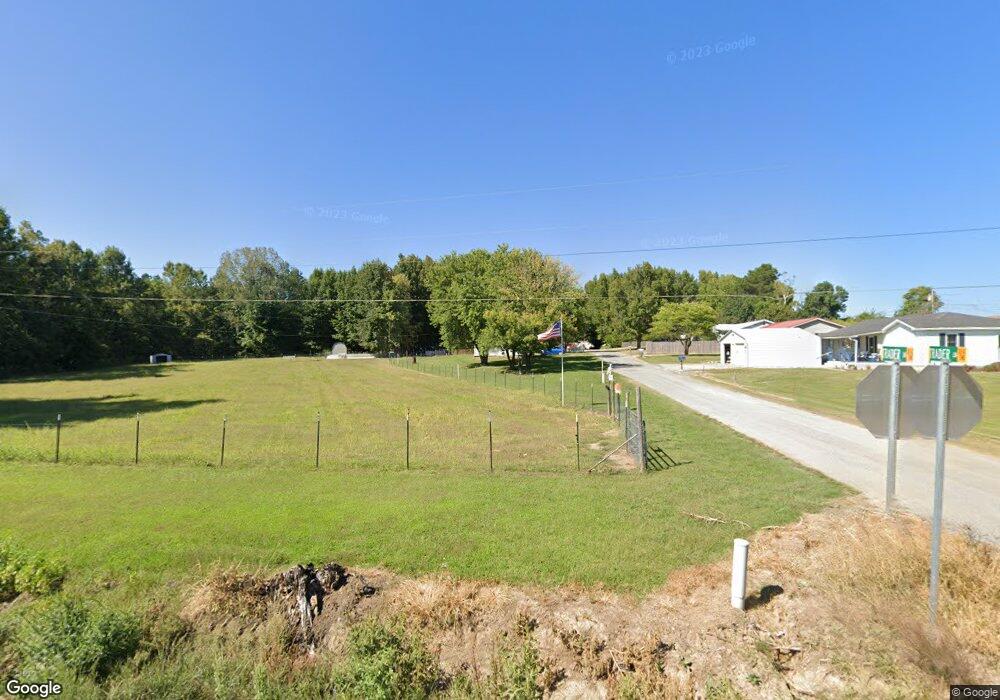
53 Trader Ln Ripley, TN 38063
Estimated Value: $121,000 - $174,000
--
Bed
1
Bath
1,496
Sq Ft
$97/Sq Ft
Est. Value
About This Home
This home is located at 53 Trader Ln, Ripley, TN 38063 and is currently estimated at $144,441, approximately $96 per square foot. 53 Trader Ln is a home located in Lauderdale County with nearby schools including Ripley Primary School, Ripley Elementary School, and Ripley Middle School.
Ownership History
Date
Name
Owned For
Owner Type
Purchase Details
Closed on
Jul 27, 2024
Sold by
Northcutt Erica
Bought by
Turner Jonathan
Current Estimated Value
Purchase Details
Closed on
Jul 28, 2022
Sold by
Buckner and Crystal
Bought by
Turner Jonathan and Turner Erica
Purchase Details
Closed on
Jul 13, 2012
Sold by
Hargett Betty
Bought by
Buckner Steven
Purchase Details
Closed on
Sep 28, 1999
Sold by
Mickey Rhodes and Mickey Angela
Bought by
Angela Rhodes
Purchase Details
Closed on
May 24, 1999
Sold by
Hargrett Gus L and Hargrett Betty
Bought by
Mickey Rhodes and Mickey Angela
Purchase Details
Closed on
Nov 9, 1998
Sold by
Eugene Geary Kenneth
Bought by
Hargrett Gus L and Hargrett Betty
Purchase Details
Closed on
Mar 20, 1997
Sold by
Jennings Leland Dba
Bought by
Eugene Geary Kenneth
Purchase Details
Closed on
Jun 28, 1996
Sold by
Taylor Fred D and Taylor Karen
Bought by
Leland Jennings
Purchase Details
Closed on
Jul 12, 1993
Purchase Details
Closed on
Jul 25, 1991
Purchase Details
Closed on
Oct 26, 1988
Create a Home Valuation Report for This Property
The Home Valuation Report is an in-depth analysis detailing your home's value as well as a comparison with similar homes in the area
Home Values in the Area
Average Home Value in this Area
Purchase History
| Date | Buyer | Sale Price | Title Company |
|---|---|---|---|
| Turner Jonathan | -- | None Listed On Document | |
| Turner Jonathan | -- | -- | |
| Buckner Steven | $2,500 | -- | |
| Angela Rhodes | -- | -- | |
| Mickey Rhodes | $43,000 | -- | |
| Hargrett Gus L | $24,300 | -- | |
| Eugene Geary Kenneth | $26,000 | -- | |
| Leland Jennings | $15,748 | -- | |
| -- | -- | -- | |
| -- | $16,400 | -- | |
| -- | -- | -- |
Source: Public Records
Tax History Compared to Growth
Tax History
| Year | Tax Paid | Tax Assessment Tax Assessment Total Assessment is a certain percentage of the fair market value that is determined by local assessors to be the total taxable value of land and additions on the property. | Land | Improvement |
|---|---|---|---|---|
| 2025 | $629 | $24,775 | $0 | $0 |
| 2024 | $629 | $24,775 | $1,200 | $23,575 |
| 2023 | $629 | $24,775 | $1,200 | $23,575 |
| 2022 | $629 | $24,775 | $1,200 | $23,575 |
| 2021 | $629 | $24,775 | $1,200 | $23,575 |
| 2020 | $609 | $24,775 | $1,200 | $23,575 |
| 2019 | $609 | $20,600 | $925 | $19,675 |
| 2018 | $385 | $13,025 | $925 | $12,100 |
| 2017 | $387 | $13,025 | $925 | $12,100 |
| 2016 | $387 | $13,025 | $925 | $12,100 |
| 2015 | $387 | $13,025 | $925 | $12,100 |
| 2014 | -- | $13,350 | $975 | $12,375 |
Source: Public Records
Map
Nearby Homes
- 4765 Conner Whitefield Rd
- 5720 Conner Whitefield Rd
- 000 Conner Whitefield Rd
- 75 Belton Rd
- 849 Belton Rd
- 176 Roy Crain Rd
- 000 Bluebird Hill Rd
- 622 Bluebird Hill Rd
- 2656 Curve Woodville Rd
- 273 N Main St
- 132 Skyline Dr
- 1216 Cedar Grove Ext Rd
- 2143 Toulon Rd
- 229 N Main St
- 2631 Highway 51 N
- 738 American Way
- 127 Jackson St
- 000 Monroe St
- 154 S Main St
- 114 S Jefferson St
- 51 Trader Ln
- 82 Trader Ln
- 54 Trader Ln
- 42 Trader Ln
- 4783 Conner Whitefield Rd
- 4769 Conner Whitefield Rd
- 30 Trader Ln
- 4795 Conner Whitefield Rd
- 4811 Conner Whitefield Rd
- 4713 Conner Whitefield Rd
- 0 Trader Ln
- 4696 Conner Whitefield Rd
- 4714 Conner Whitefield Rd
- 4760 Conner Whitefield Rd
- 4806 Conner Whitefield Rd
- 4848 Conner Whitefield Rd
- 2308 George Brown Rd
- 4874 Conner Whitefield Rd
- 4959 Conner Whitefield Rd
- 4443 Conner Whitefield Rd