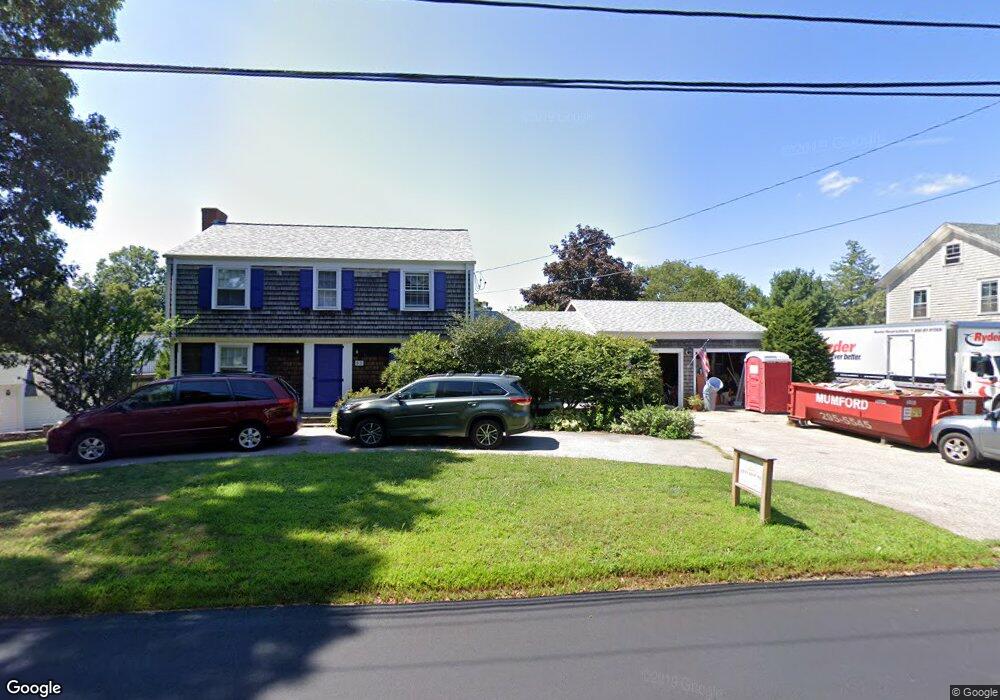
53 Upland Way Barrington, RI 02806
North Barrington NeighborhoodEstimated Value: $692,000 - $844,000
4
Beds
2
Baths
1,808
Sq Ft
$426/Sq Ft
Est. Value
About This Home
This home is located at 53 Upland Way, Barrington, RI 02806 and is currently estimated at $770,395, approximately $426 per square foot. 53 Upland Way is a home located in Bristol County with nearby schools including Barrington High School, St Luke Elementary School, and St Mary Academy-Bay View.
Ownership History
Date
Name
Owned For
Owner Type
Purchase Details
Closed on
Jun 6, 1991
Sold by
Desisto Antonio M
Bought by
Fales David E
Current Estimated Value
Home Financials for this Owner
Home Financials are based on the most recent Mortgage that was taken out on this home.
Original Mortgage
$143,400
Interest Rate
9.42%
Create a Home Valuation Report for This Property
The Home Valuation Report is an in-depth analysis detailing your home's value as well as a comparison with similar homes in the area
Home Values in the Area
Average Home Value in this Area
Purchase History
| Date | Buyer | Sale Price | Title Company |
|---|---|---|---|
| Fales David E | $182,000 | -- | |
| Fales David E | $182,000 | -- |
Source: Public Records
Mortgage History
| Date | Status | Borrower | Loan Amount |
|---|---|---|---|
| Open | Fales David E | $120,000 | |
| Closed | Fales David E | $120,000 | |
| Closed | Fales David E | $127,700 | |
| Closed | Fales David E | $143,400 |
Source: Public Records
Tax History Compared to Growth
Tax History
| Year | Tax Paid | Tax Assessment Tax Assessment Total Assessment is a certain percentage of the fair market value that is determined by local assessors to be the total taxable value of land and additions on the property. | Land | Improvement |
|---|---|---|---|---|
| 2025 | $9,449 | $616,000 | $307,000 | $309,000 |
| 2024 | $9,086 | $616,000 | $307,000 | $309,000 |
| 2023 | $8,871 | $437,000 | $171,000 | $266,000 |
| 2022 | $8,587 | $437,000 | $171,000 | $266,000 |
| 2021 | $8,369 | $437,000 | $171,000 | $266,000 |
| 2020 | $8,235 | $394,000 | $144,000 | $250,000 |
| 2019 | $7,035 | $350,000 | $144,000 | $206,000 |
| 2018 | $6,825 | $350,000 | $144,000 | $206,000 |
| 2017 | $6,828 | $341,400 | $143,300 | $198,100 |
| 2016 | $6,299 | $341,400 | $143,300 | $198,100 |
| 2015 | $6,231 | $341,400 | $143,300 | $198,100 |
| 2014 | $5,715 | $312,300 | $146,300 | $166,000 |
Source: Public Records
Map
Nearby Homes
- 205 Lincoln Ave
- 381 Maple Ave
- 7 Carpenter Ave
- 351 County Rd
- 20 Townsend St
- 16 Highview Ave
- 0 Bogman Rd
- 1 3rd St
- 27 Rosedale Ave
- 6 Conway Dr
- 4 Buckingham St
- 150 Alfred Drowne Rd
- 45 Washington Rd
- 22 Mayfield Rd
- 6 Kenmore Ct
- 29 Lake Ave
- 164 Bay Spring Ave
- 299 Narragansett Ave
- 140 Promenade St
- 85 Nayatt Rd