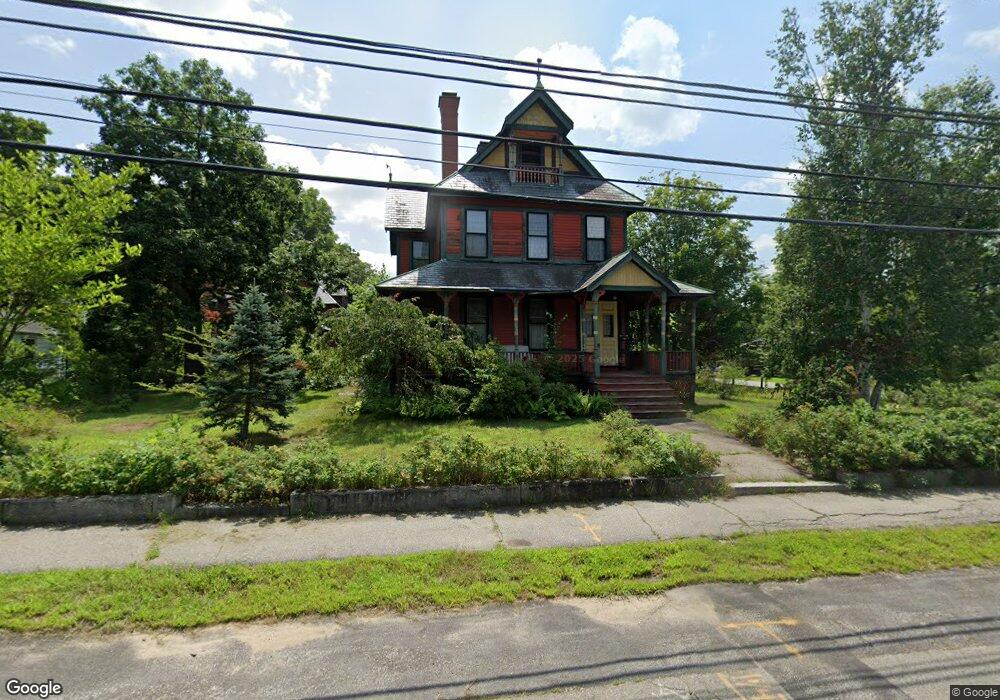
53 West St Concord, NH 03301
South End NeighborhoodEstimated Value: $441,998 - $568,000
4
Beds
2
Baths
2,716
Sq Ft
$178/Sq Ft
Est. Value
About This Home
This home is located at 53 West St, Concord, NH 03301 and is currently estimated at $484,500, approximately $178 per square foot. 53 West St is a home located in Merrimack County with nearby schools including Abbot-Downing School, Rundlett Middle School, and Concord High School.
Ownership History
Date
Name
Owned For
Owner Type
Purchase Details
Closed on
Jul 26, 2024
Sold by
Doe Donald and Doe Marilyn G
Bought by
Doe Ft and Doe
Current Estimated Value
Purchase Details
Closed on
Nov 12, 1997
Sold by
Cfx Bank
Bought by
Doe Donald and Doe Marilyn G
Home Financials for this Owner
Home Financials are based on the most recent Mortgage that was taken out on this home.
Original Mortgage
$118,750
Interest Rate
7.23%
Mortgage Type
Purchase Money Mortgage
Purchase Details
Closed on
Feb 4, 1997
Sold by
Murawski John and Murawski Joanne L
Bought by
Concord Svgs Bk
Create a Home Valuation Report for This Property
The Home Valuation Report is an in-depth analysis detailing your home's value as well as a comparison with similar homes in the area
Home Values in the Area
Average Home Value in this Area
Purchase History
| Date | Buyer | Sale Price | Title Company |
|---|---|---|---|
| Doe Ft | -- | None Available | |
| Doe Ft | -- | None Available | |
| Doe Donald | $125,000 | -- | |
| Doe Donald A | $125,000 | -- | |
| Concord Svgs Bk | $125,000 | -- | |
| Concord Svgs Bk | $125,000 | -- |
Source: Public Records
Mortgage History
| Date | Status | Borrower | Loan Amount |
|---|---|---|---|
| Previous Owner | Concord Svgs Bk | $92,000 | |
| Previous Owner | Concord Svgs Bk | $118,750 |
Source: Public Records
Tax History
| Year | Tax Paid | Tax Assessment Tax Assessment Total Assessment is a certain percentage of the fair market value that is determined by local assessors to be the total taxable value of land and additions on the property. | Land | Improvement |
|---|---|---|---|---|
| 2025 | $8,259 | $283,700 | $99,500 | $184,200 |
| 2024 | $7,856 | $283,700 | $99,500 | $184,200 |
| 2023 | $7,620 | $283,700 | $99,500 | $184,200 |
| 2022 | $7,345 | $283,700 | $99,500 | $184,200 |
| 2021 | $7,046 | $280,500 | $99,500 | $181,000 |
| 2020 | $6,893 | $257,600 | $83,100 | $174,500 |
| 2019 | $6,634 | $238,800 | $79,300 | $159,500 |
| 2018 | $6,298 | $223,400 | $79,300 | $144,100 |
| 2017 | $6,038 | $213,800 | $77,900 | $135,900 |
| 2016 | $5,694 | $205,800 | $77,900 | $127,900 |
| 2015 | $5,479 | $198,200 | $70,800 | $127,400 |
| 2014 | $5,314 | $198,200 | $70,800 | $127,400 |
| 2013 | -- | $197,200 | $70,800 | $126,400 |
| 2012 | -- | $207,700 | $70,800 | $136,900 |
Source: Public Records
Map
Nearby Homes
Your Personal Tour Guide
Ask me questions while you tour the home.