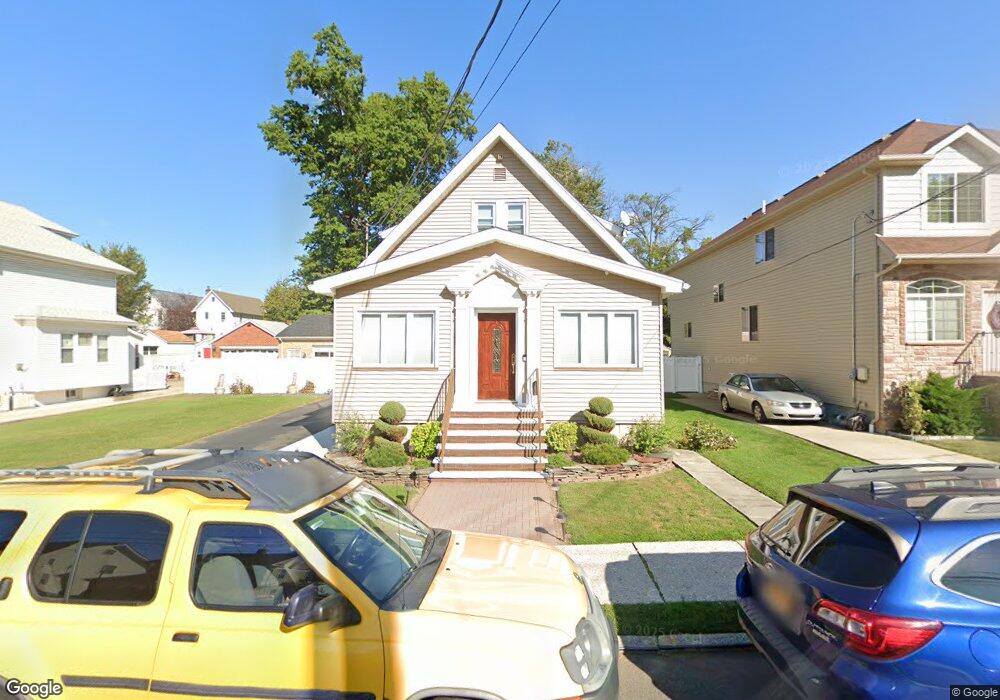
53 Wheeler Ave Staten Island, NY 10314
Westerleigh NeighborhoodEstimated Value: $792,000 - $872,000
--
Bed
--
Bath
1,606
Sq Ft
$522/Sq Ft
Est. Value
About This Home
This home is located at 53 Wheeler Ave, Staten Island, NY 10314 and is currently estimated at $838,960, approximately $522 per square foot. 53 Wheeler Ave is a home located in Richmond County with nearby schools including P.S. 54 Charles W Leng, Is 72 Rocco Laurie, and Susan E Wagner High School.
Ownership History
Date
Name
Owned For
Owner Type
Purchase Details
Closed on
Jan 6, 1996
Sold by
Melfi James E and Melfi Yvonne
Bought by
Melfi James A and Melfi Carol J
Current Estimated Value
Home Financials for this Owner
Home Financials are based on the most recent Mortgage that was taken out on this home.
Original Mortgage
$200,000
Interest Rate
4%
Mortgage Type
Seller Take Back
Create a Home Valuation Report for This Property
The Home Valuation Report is an in-depth analysis detailing your home's value as well as a comparison with similar homes in the area
Home Values in the Area
Average Home Value in this Area
Purchase History
| Date | Buyer | Sale Price | Title Company |
|---|---|---|---|
| Melfi James A | $250,000 | -- |
Source: Public Records
Mortgage History
| Date | Status | Borrower | Loan Amount |
|---|---|---|---|
| Closed | Melfi James A | $200,000 |
Source: Public Records
Tax History Compared to Growth
Tax History
| Year | Tax Paid | Tax Assessment Tax Assessment Total Assessment is a certain percentage of the fair market value that is determined by local assessors to be the total taxable value of land and additions on the property. | Land | Improvement |
|---|---|---|---|---|
| 2025 | $7,063 | $46,080 | $19,077 | $27,003 |
| 2024 | $7,075 | $44,340 | $18,703 | $25,637 |
| 2023 | $6,721 | $34,496 | $15,233 | $19,263 |
| 2022 | $6,210 | $43,500 | $22,680 | $20,820 |
| 2021 | $6,546 | $37,920 | $22,680 | $15,240 |
| 2020 | $6,541 | $39,000 | $22,680 | $16,320 |
| 2019 | $6,081 | $39,420 | $22,680 | $16,740 |
| 2018 | $5,562 | $28,747 | $17,872 | $10,875 |
| 2017 | $5,229 | $27,120 | $22,680 | $4,440 |
| 2016 | $6,071 | $31,920 | $22,680 | $9,240 |
| 2015 | $5,637 | $32,817 | $18,136 | $14,681 |
| 2014 | $5,637 | $30,960 | $18,900 | $12,060 |
Source: Public Records
Map
Nearby Homes