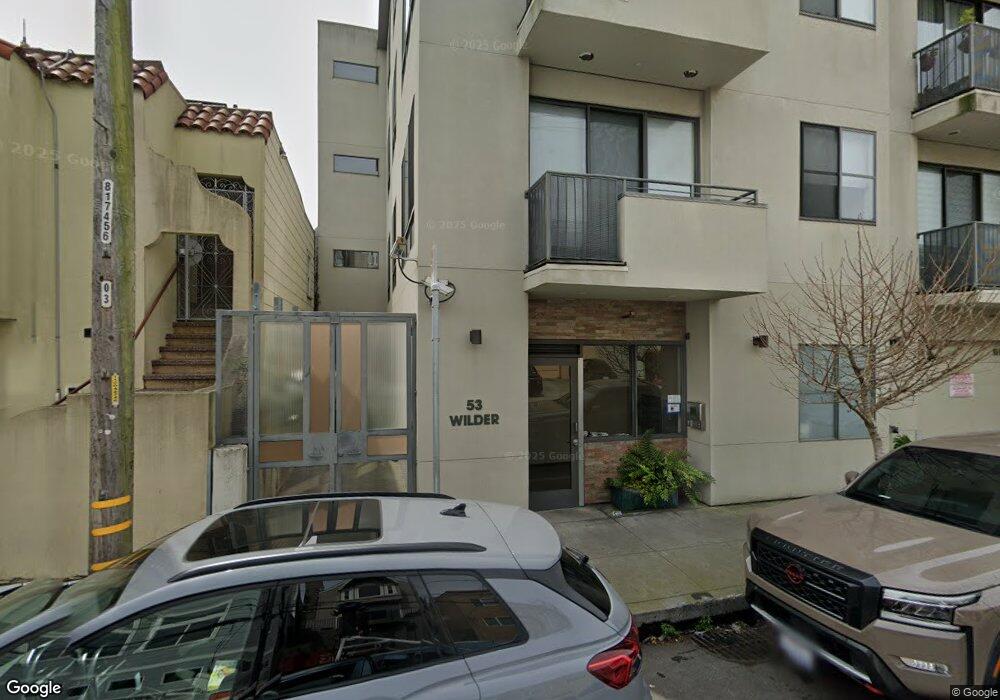
53 Wilder St Unit 304 San Francisco, CA 94131
Glen Park NeighborhoodEstimated Value: $1,100,000 - $1,337,000
2
Beds
2
Baths
1,301
Sq Ft
$900/Sq Ft
Est. Value
About This Home
This home is located at 53 Wilder St Unit 304, San Francisco, CA 94131 and is currently estimated at $1,170,681, approximately $899 per square foot. 53 Wilder St Unit 304 is a home located in San Francisco County with nearby schools including Glen Park Elementary School, James Lick Middle School, and KIPP San Francisco College Preparatory.
Ownership History
Date
Name
Owned For
Owner Type
Purchase Details
Closed on
Sep 10, 2012
Sold by
Hiranandani Vineeta
Bought by
Bechtel Brian L and Bechtel Mary M
Current Estimated Value
Home Financials for this Owner
Home Financials are based on the most recent Mortgage that was taken out on this home.
Original Mortgage
$625,500
Outstanding Balance
$431,389
Interest Rate
3.5%
Mortgage Type
Purchase Money Mortgage
Estimated Equity
$739,292
Purchase Details
Closed on
Feb 14, 2008
Sold by
Hiranandani Vineeta
Bought by
Hiranandani Vineeta
Purchase Details
Closed on
Sep 6, 2006
Sold by
Diamond Llc
Bought by
Hiranandani Vineeta
Home Financials for this Owner
Home Financials are based on the most recent Mortgage that was taken out on this home.
Original Mortgage
$579,000
Interest Rate
6.62%
Mortgage Type
Purchase Money Mortgage
Create a Home Valuation Report for This Property
The Home Valuation Report is an in-depth analysis detailing your home's value as well as a comparison with similar homes in the area
Home Values in the Area
Average Home Value in this Area
Purchase History
| Date | Buyer | Sale Price | Title Company |
|---|---|---|---|
| Bechtel Brian L | $890,000 | Old Republic Title Company | |
| Hiranandani Vineeta | -- | None Available | |
| Hiranandani Vineeta | $779,000 | Old Republic Title Company |
Source: Public Records
Mortgage History
| Date | Status | Borrower | Loan Amount |
|---|---|---|---|
| Open | Bechtel Brian L | $625,500 | |
| Previous Owner | Hiranandani Vineeta | $579,000 |
Source: Public Records
Tax History Compared to Growth
Tax History
| Year | Tax Paid | Tax Assessment Tax Assessment Total Assessment is a certain percentage of the fair market value that is determined by local assessors to be the total taxable value of land and additions on the property. | Land | Improvement |
|---|---|---|---|---|
| 2025 | $13,347 | $1,095,962 | $547,981 | $547,981 |
| 2024 | $13,347 | $1,074,474 | $537,237 | $537,237 |
| 2023 | $13,127 | $1,053,406 | $526,703 | $526,703 |
| 2022 | $12,866 | $1,032,752 | $516,376 | $516,376 |
| 2021 | $12,636 | $1,012,502 | $506,251 | $506,251 |
| 2020 | $12,699 | $1,002,122 | $501,061 | $501,061 |
| 2019 | $12,265 | $982,474 | $491,237 | $491,237 |
| 2018 | $11,852 | $963,210 | $481,605 | $481,605 |
| 2017 | $11,413 | $944,324 | $472,162 | $472,162 |
| 2016 | $11,219 | $925,808 | $462,904 | $462,904 |
| 2015 | $11,079 | $911,902 | $455,951 | $455,951 |
| 2014 | $10,787 | $894,040 | $447,020 | $447,020 |
Source: Public Records
Map
Nearby Homes
- 43 Sussex St
- 101 Moffitt St
- 246 Bemis St
- 54-56 Monterey Blvd
- 58 Monterey Blvd
- 101 Joost Ave
- 200 Cayuga Ave
- 25 Mizpah St
- 474 Arlington St Unit 478
- 8 Mateo St
- 101 Farnum St
- 360 Laidley St Unit 362
- 35 Admiral Ave
- 222 Monterey Blvd
- 225 Cotter St
- 78 Theresa St
- 408 Gold Mine Dr
- 37 Miguel St Unit 6
- 30 Harry St
- 210 Laidley St
- 53 Wilder St
- 53 Wilder St Unit 407
- 53 Wilder St Unit 402
- 53 Wilder St Unit 303
- 53 Wilder St Unit 406
- 53 Wilder St Unit 405
- 53 Wilder St Unit 404
- 53 Wilder St Unit 403
- 53 Wilder St Unit 401
- 53 Wilder St Unit 302
- 53 Wilder St Unit 301
- 53 Wilder St Unit 204
- 53 Wilder St Unit 203
- 53 Wilder St Unit 202
- 53 Wilder St Unit 201
- 49 Wilder St
- 584 Bosworth St
- 590 Bosworth St
- 683 Chenery St
- 41 Wilder St