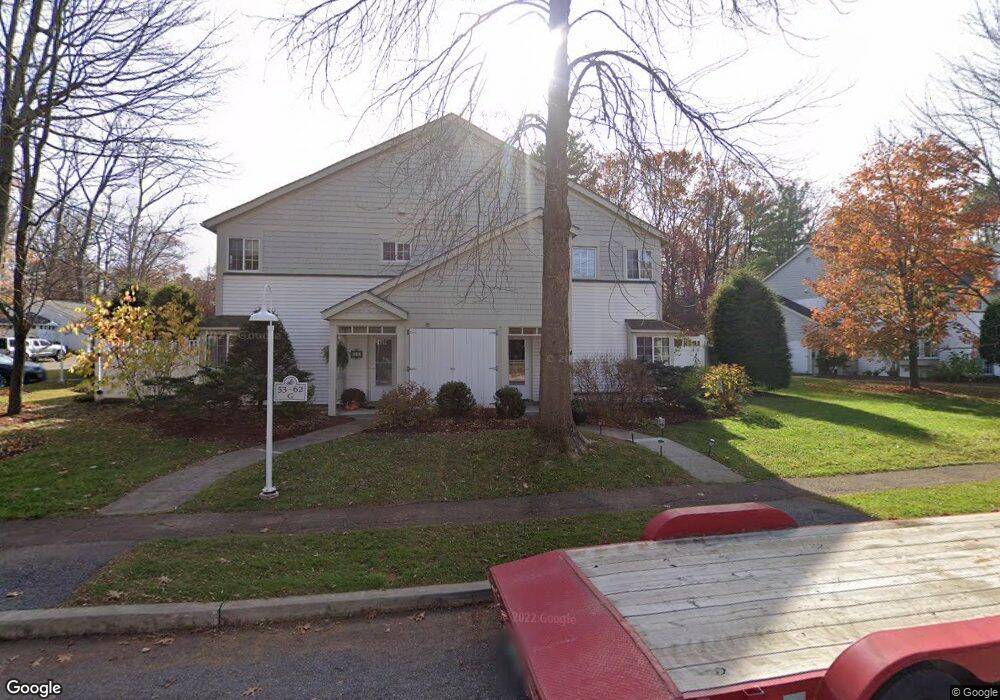
53 Winding Brook Dr Unit 53 South Burlington, VT 05403
Estimated Value: $373,000 - $433,000
2
Beds
3
Baths
1,525
Sq Ft
$258/Sq Ft
Est. Value
About This Home
This home is located at 53 Winding Brook Dr Unit 53, South Burlington, VT 05403 and is currently estimated at $393,768, approximately $258 per square foot. 53 Winding Brook Dr Unit 53 is a home located in Chittenden County with nearby schools including Frederick H. Tuttle Middle School, South Burlington High School, and The Bellwether School.
Ownership History
Date
Name
Owned For
Owner Type
Purchase Details
Closed on
Jun 10, 2021
Sold by
Larrow Julia
Bought by
Carpenter John T
Current Estimated Value
Purchase Details
Closed on
Jul 7, 2010
Sold by
Bell Rosbnberg Kathleen E and Rosenberg Nathan
Bought by
Larrow Julia
Purchase Details
Closed on
Dec 19, 2006
Sold by
Warhol Robyn R
Bought by
Bell Kathleen E
Purchase Details
Closed on
Nov 22, 2002
Sold by
Riley Stacy and Riley Bryan
Bought by
Warhol Robyn R
Purchase Details
Closed on
Apr 23, 1999
Sold by
Ducray Sarah J
Bought by
Riley Bryan J and Riley Stacy E
Create a Home Valuation Report for This Property
The Home Valuation Report is an in-depth analysis detailing your home's value as well as a comparison with similar homes in the area
Home Values in the Area
Average Home Value in this Area
Purchase History
| Date | Buyer | Sale Price | Title Company |
|---|---|---|---|
| Carpenter John T | $305,000 | -- | |
| Carpenter John T | $305,000 | -- | |
| Larrow Julia | $215,000 | -- | |
| Larrow Julia | $215,000 | -- | |
| Bell Kathleen E | $220,000 | -- | |
| Bell Kathleen E | $220,000 | -- | |
| Warhol Robyn R | $165,000 | -- | |
| Warhol Robyn R | $165,000 | -- | |
| Riley Bryan J | $114,500 | -- | |
| Riley Bryan J | $114,500 | -- |
Source: Public Records
Tax History Compared to Growth
Tax History
| Year | Tax Paid | Tax Assessment Tax Assessment Total Assessment is a certain percentage of the fair market value that is determined by local assessors to be the total taxable value of land and additions on the property. | Land | Improvement |
|---|---|---|---|---|
| 2024 | $6,034 | $273,900 | $0 | $273,900 |
| 2023 | $5,253 | $273,900 | $0 | $273,900 |
| 2022 | $4,824 | $273,900 | $0 | $273,900 |
| 2021 | $4,820 | $273,900 | $0 | $273,900 |
| 2020 | $3,800 | $217,300 | $4,336 | $212,964 |
| 2019 | $4,663 | $217,300 | $4,336 | $212,964 |
| 2018 | $4,474 | $217,300 | $4,336 | $212,964 |
| 2017 | $3,846 | $217,300 | $4,336 | $212,964 |
| 2016 | $2,817 | $217,300 | $4,336 | $212,964 |
Source: Public Records
Map
Nearby Homes
- 41 Winding Brook Dr
- 45 Winding Brook Dr
- 82 Winding Brook Dr
- 100 Kennedy Dr Unit 62
- 100 Kennedy Dr Unit 59
- 100 Kennedy Dr Unit 29
- 107 Sugar Tree Ln
- 10 Southview Dr
- 341 O'Brien Farm Rd
- 85 Bayberry Ln
- 8 Timber Ln Unit 24
- 8 Timber Ln Unit 29
- 57 Hayes Ave
- 136 Two Brothers Dr
- 24 Hayes Ave
- 49 Daniel Dr
- 213 Leo Ln
- 297 Old Farm Rd
- 437 Old Farm Rd
- 445 Old Farm Rd
- 53 Winding Brook Dr
- 54 Winding Brook Dr
- 55 Winding Brook Dr
- 56 Winding Brook Dr
- 57 Winding Brook Dr
- 58 Winding Brook Dr
- 59 Winding Brook Dr
- 60 Winding Brook Dr
- 63 Winding Brook Dr
- 61 Winding Brook Dr Unit 61
- 61 Winding Brook Dr
- 62 Winding Brook Dr
- 64 Winding Brook Dr
- 44 Winding Brook Dr
- 66 Winding Brook Dr
- 0 Lot 6 Sadie Ln Unit 4468659
- 51 Winding Brook Dr
- 49 Winding Brook Dr
- 52 Winding Brook Dr Unit 52
- 47 Winding Brook Dr