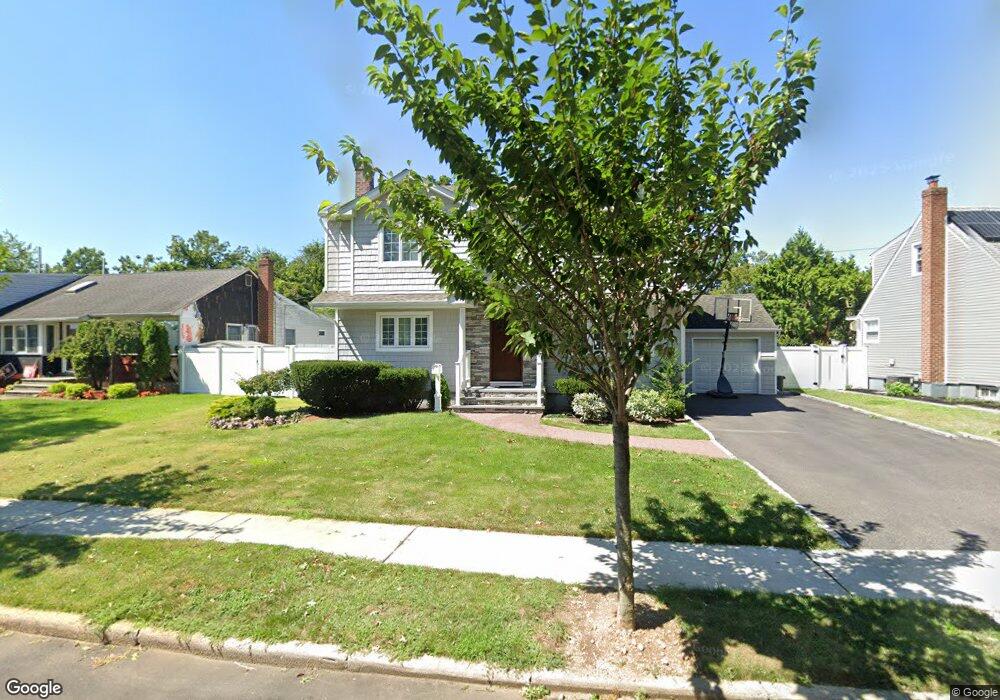
530 Arlington Dr Seaford, NY 11783
Estimated Value: $699,000 - $734,410
3
Beds
1
Bath
1,718
Sq Ft
$417/Sq Ft
Est. Value
About This Home
This home is located at 530 Arlington Dr, Seaford, NY 11783 and is currently estimated at $716,705, approximately $417 per square foot. 530 Arlington Dr is a home located in Nassau County with nearby schools including Michael F. Stokes Elementary School, J Fred Sparke Elementary School, and Island Trees Middle School.
Ownership History
Date
Name
Owned For
Owner Type
Purchase Details
Closed on
Sep 29, 2016
Sold by
Supple Stephen
Bought by
Martinez Alcides and Demartinez Miryan Castro
Current Estimated Value
Home Financials for this Owner
Home Financials are based on the most recent Mortgage that was taken out on this home.
Original Mortgage
$350,000
Outstanding Balance
$307,502
Interest Rate
3.46%
Mortgage Type
New Conventional
Estimated Equity
$409,203
Purchase Details
Closed on
Dec 24, 2014
Sold by
Supple Alison and Supple Stephen
Bought by
Supple Stephen
Home Financials for this Owner
Home Financials are based on the most recent Mortgage that was taken out on this home.
Original Mortgage
$288,000
Interest Rate
4.02%
Mortgage Type
Purchase Money Mortgage
Purchase Details
Closed on
Nov 5, 2008
Sold by
Fischer Margaret A and Meehan Daniel J
Bought by
Supple Stephen and Wolkiewicz Alison
Purchase Details
Closed on
Mar 2, 2005
Sold by
Meehan Margaret
Create a Home Valuation Report for This Property
The Home Valuation Report is an in-depth analysis detailing your home's value as well as a comparison with similar homes in the area
Home Values in the Area
Average Home Value in this Area
Purchase History
| Date | Buyer | Sale Price | Title Company |
|---|---|---|---|
| Martinez Alcides | $379,000 | Chicago Title Insurance Comp | |
| Supple Stephen | $23,270 | None Available | |
| Supple Stephen | $340,000 | First American Title Insuran | |
| -- | -- | -- |
Source: Public Records
Mortgage History
| Date | Status | Borrower | Loan Amount |
|---|---|---|---|
| Open | Martinez Alcides | $350,000 | |
| Previous Owner | Supple Stephen | $288,000 |
Source: Public Records
Tax History Compared to Growth
Tax History
| Year | Tax Paid | Tax Assessment Tax Assessment Total Assessment is a certain percentage of the fair market value that is determined by local assessors to be the total taxable value of land and additions on the property. | Land | Improvement |
|---|---|---|---|---|
| 2025 | $9,735 | $419 | $220 | $199 |
| 2024 | $2,968 | $419 | $220 | $199 |
| 2023 | $9,402 | $427 | $224 | $203 |
| 2022 | $9,402 | $419 | $220 | $199 |
| 2021 | $12,176 | $433 | $227 | $206 |
| 2020 | $9,639 | $566 | $470 | $96 |
| 2019 | $9,063 | $606 | $416 | $190 |
| 2018 | $9,177 | $732 | $0 | $0 |
| 2017 | $5,583 | $732 | $503 | $229 |
| 2016 | $8,779 | $732 | $503 | $229 |
| 2015 | $2,861 | $702 | $503 | $199 |
| 2014 | $2,861 | $702 | $503 | $199 |
| 2013 | $2,683 | $702 | $503 | $199 |
Source: Public Records
Map
Nearby Homes
- 580 Heathcliff Dr
- 3980 Kingsberry Rd
- 3805 Colonial Ct
- 4042 Old Post Rd
- 647 Seamans Neck Rd
- 3977 Wellwood Rd
- 6 Regal Ln
- 4129 Duff Place
- 3 Brewster Gate
- 17 Rural Ln
- 4195 Florence Rd
- 68 Thorne Ave
- 3842 Whitman St
- 243 Elm Dr S
- 9 Redwood Ln
- 520 Ann Ln
- 4278 Clarissa Rd
- 294 Swansdowne Dr
- 27 Midlawn Dr
- 3901 Moore St
- 536 Arlington Dr
- 524 Arlington Dr
- 563 Knoll Ct
- 542 Arlington Dr
- 518 Arlington Dr
- 531 Arlington Dr
- 525 Arlington Dr
- 537 Arlington Dr
- 557 Knoll Ct
- 519 Arlington Dr
- 512 Arlington Dr
- 543 Arlington Dr
- 3917 Clove Ct
- 3905 Clove Ct
- 571 Knoll Ct
- 551 Knoll Ct
- 513 Arlington Dr
- 3899 Clove Ct
- 530 Heathcliff Dr
- 536 Heathcliff Dr