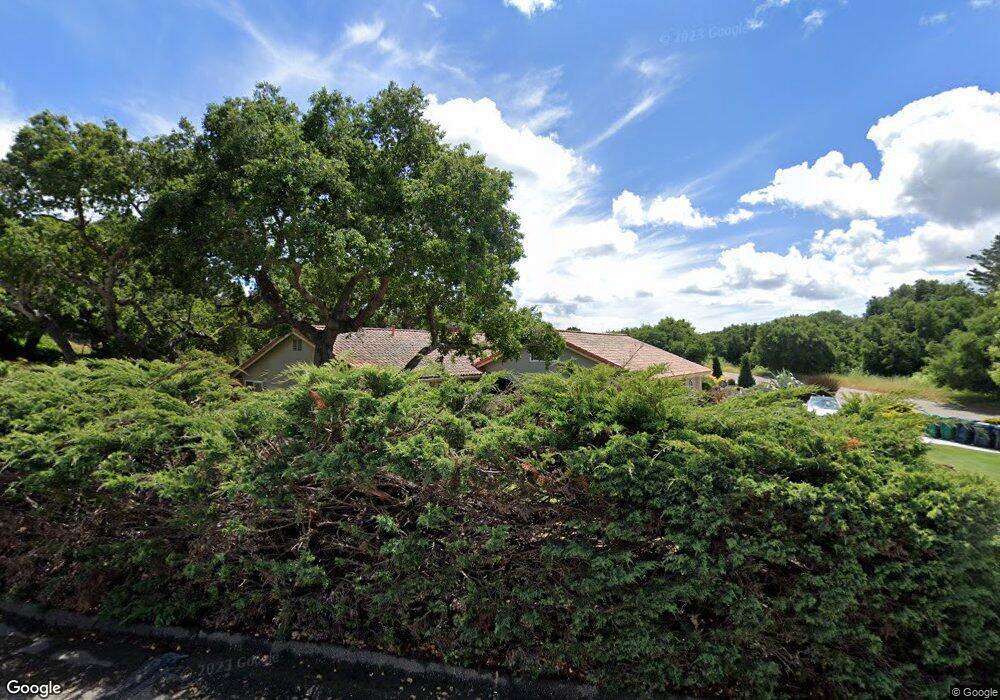
530 Cypress Ct Lompoc, CA 93436
Estimated Value: $949,000 - $1,245,000
4
Beds
3
Baths
2,616
Sq Ft
$416/Sq Ft
Est. Value
About This Home
This home is located at 530 Cypress Ct, Lompoc, CA 93436 and is currently estimated at $1,088,299, approximately $416 per square foot. 530 Cypress Ct is a home located in Santa Barbara County with nearby schools including Buena Vista Elementary School and Cabrillo High School.
Ownership History
Date
Name
Owned For
Owner Type
Purchase Details
Closed on
Dec 14, 2022
Sold by
Pino Robert K and Revocabl Andrea
Bought by
Robert K Pino And Andrea M Pino Revocable Liv
Current Estimated Value
Home Financials for this Owner
Home Financials are based on the most recent Mortgage that was taken out on this home.
Original Mortgage
$75,000
Outstanding Balance
$66,021
Interest Rate
6.38%
Mortgage Type
New Conventional
Estimated Equity
$1,022,278
Purchase Details
Closed on
Feb 22, 2022
Sold by
Pino Robert K and Pino Andrea M
Bought by
Robert K Pino And Andrea M Pino Revocable Liv and Pin Andrea
Purchase Details
Closed on
Dec 31, 2015
Sold by
Mosby Steven M and Mosby Malia M
Bought by
Pino Robert K and Pino Andrea M
Home Financials for this Owner
Home Financials are based on the most recent Mortgage that was taken out on this home.
Original Mortgage
$428,000
Interest Rate
3.94%
Mortgage Type
New Conventional
Purchase Details
Closed on
Feb 12, 2013
Sold by
Mcdaniel Jolita
Bought by
Mosby Steven M and Mosby Malia M
Home Financials for this Owner
Home Financials are based on the most recent Mortgage that was taken out on this home.
Original Mortgage
$328,000
Interest Rate
3.53%
Mortgage Type
New Conventional
Purchase Details
Closed on
Sep 7, 2010
Sold by
Mcdaniel Jolita
Bought by
Mcdaniel Jolita and Mosby Steven M
Purchase Details
Closed on
Mar 12, 2003
Sold by
Mcdaniel Billy R and Mcdaniel Jolita
Bought by
Mcdaniel Billy R and Mcdaniel Jolita
Purchase Details
Closed on
Aug 21, 1996
Sold by
Orr Mitchell K and Orr Lori C
Bought by
Mcdaniel Billy R and Mcdaniel Jolita
Home Financials for this Owner
Home Financials are based on the most recent Mortgage that was taken out on this home.
Original Mortgage
$207,000
Interest Rate
8.42%
Purchase Details
Closed on
May 6, 1995
Sold by
Kohler Mark A
Bought by
Pimienta Kohler Ineta I
Home Financials for this Owner
Home Financials are based on the most recent Mortgage that was taken out on this home.
Original Mortgage
$100,000
Interest Rate
8.51%
Purchase Details
Closed on
Apr 26, 1995
Sold by
Pimienta Kohler Ineta I and Pimienta Ineta I
Bought by
Orr Mitchell K and Orr Lori C
Home Financials for this Owner
Home Financials are based on the most recent Mortgage that was taken out on this home.
Original Mortgage
$100,000
Interest Rate
8.51%
Create a Home Valuation Report for This Property
The Home Valuation Report is an in-depth analysis detailing your home's value as well as a comparison with similar homes in the area
Home Values in the Area
Average Home Value in this Area
Purchase History
| Date | Buyer | Sale Price | Title Company |
|---|---|---|---|
| Robert K Pino And Andrea M Pino Revocable Liv | -- | First American Title | |
| Robert K Pino And Andrea M Pino Revocable Liv | -- | None Listed On Document | |
| Pino Robert K | $535,000 | First American Title Company | |
| Mosby Steven M | -- | First American Title Company | |
| Mcdaniel Jolita | -- | None Available | |
| Mcdaniel Billy R | -- | -- | |
| Mcdaniel Billy R | $278,500 | Chicago Title Co | |
| Pimienta Kohler Ineta I | -- | Chicago Title Company | |
| Orr Mitchell K | $268,000 | Chicago Title Company |
Source: Public Records
Mortgage History
| Date | Status | Borrower | Loan Amount |
|---|---|---|---|
| Open | Robert K Pino And Andrea M Pino Revocable Liv | $75,000 | |
| Previous Owner | Pino Robert K | $428,000 | |
| Previous Owner | Mosby Steven M | $328,000 | |
| Previous Owner | Mcdaniel Billy R | $207,000 | |
| Previous Owner | Orr Mitchell K | $100,000 |
Source: Public Records
Tax History Compared to Growth
Tax History
| Year | Tax Paid | Tax Assessment Tax Assessment Total Assessment is a certain percentage of the fair market value that is determined by local assessors to be the total taxable value of land and additions on the property. | Land | Improvement |
|---|---|---|---|---|
| 2025 | $7,119 | $633,326 | $177,566 | $455,760 |
| 2023 | $7,119 | $608,735 | $170,672 | $438,063 |
| 2022 | $7,003 | $596,800 | $167,326 | $429,474 |
| 2021 | $7,079 | $585,099 | $164,046 | $421,053 |
| 2020 | $7,006 | $579,100 | $162,364 | $416,736 |
| 2019 | $6,898 | $567,746 | $159,181 | $408,565 |
| 2018 | $6,797 | $556,614 | $156,060 | $400,554 |
| 2017 | $6,589 | $545,700 | $153,000 | $392,700 |
| 2016 | $4,421 | $383,152 | $130,694 | $252,458 |
| 2015 | $4,388 | $377,397 | $128,731 | $248,666 |
| 2014 | $4,324 | $370,005 | $126,210 | $243,795 |
Source: Public Records
Map
Nearby Homes
- 579 Saint Andrews Way
- 4131 Oakwood Rd
- 445 Firestone Way
- 4464 Greenbrier Rd
- 317 Medinah Ln
- 0 Oak Hill Dr Unit 24-783
- 369 Falcon Crest Dr
- 220 Oak Hill Dr
- 210 Oak Hill Dr
- 3925 Clubhouse Ct
- 3987 Agena Way
- 189 Galaxy Way
- 3986 Spica Way
- 4185 Vanguard Dr
- 196 Galaxy Way
- 4123 Constellation Rd
- 4533 Falcon Dr
- 244 Pegasus Ave
- 1445 Calle Marana
- 4406 Capricorn Ct
- 536 Cypress Ct
- 515 Cypress Ct
- 601 Saint Andrews Way
- 527 Cypress Ct
- 608 Saint Andrews Way
- 706 Cypress Way
- 708 Cypress Way
- 648 Saint Andrews Way
- 668 Saint Andrews Way
- 710 Cypress Way
- 609 Burning Tree Way
- 584 Saint Andrews Way
- 688 Saint Andrews Way
- 0 Saint Andrews Way
- 567 Saint Andrews Way
- 700 Saint Andrews Way
- 4255 Manzanita Rd
- 619 Burning Tree Way