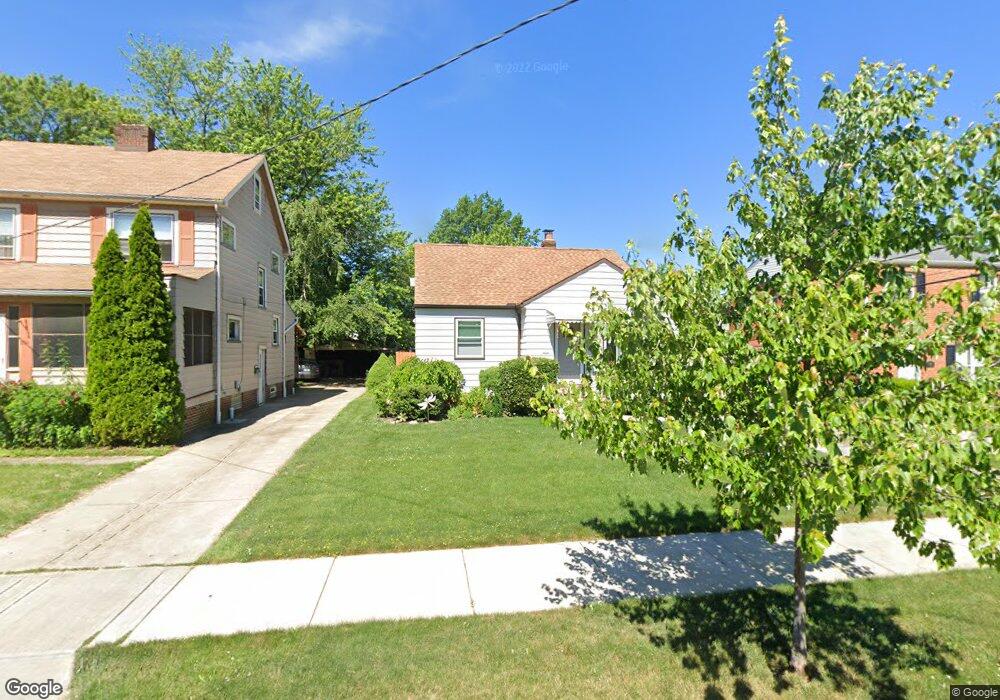
530 E 215th St Euclid, OH 44123
Estimated Value: $117,021 - $157,000
2
Beds
1
Bath
1,177
Sq Ft
$113/Sq Ft
Est. Value
About This Home
This home is located at 530 E 215th St, Euclid, OH 44123 and is currently estimated at $133,255, approximately $113 per square foot. 530 E 215th St is a home located in Cuyahoga County with nearby schools including Arbor Elementary School, Euclid Middle School, and Euclid High School.
Ownership History
Date
Name
Owned For
Owner Type
Purchase Details
Closed on
Jan 19, 2018
Sold by
Mjb Investment Properties Llc
Bought by
Sanders Kathy Marie
Current Estimated Value
Home Financials for this Owner
Home Financials are based on the most recent Mortgage that was taken out on this home.
Original Mortgage
$125,564
Outstanding Balance
$106,927
Interest Rate
4.75%
Mortgage Type
FHA
Estimated Equity
$26,328
Purchase Details
Closed on
May 12, 2017
Sold by
Doe John and Valenti James
Bought by
Mjb Investment Properties
Purchase Details
Closed on
Aug 27, 1993
Sold by
Mauceri Frank D
Bought by
Valenti James
Purchase Details
Closed on
Apr 1, 1985
Sold by
Mauceri Frank D and Mauceri Frances J
Bought by
Mauceri Frank D
Purchase Details
Closed on
Jan 1, 1975
Bought by
Mauceri Frank D and Mauceri Frances J
Create a Home Valuation Report for This Property
The Home Valuation Report is an in-depth analysis detailing your home's value as well as a comparison with similar homes in the area
Home Values in the Area
Average Home Value in this Area
Purchase History
| Date | Buyer | Sale Price | Title Company |
|---|---|---|---|
| Sanders Kathy Marie | $129,900 | None Available | |
| Mjb Investment Properties | $25,000 | None Available | |
| Valenti James | $70,500 | -- | |
| Mauceri Frank D | -- | -- | |
| Mauceri Frank D | -- | -- |
Source: Public Records
Mortgage History
| Date | Status | Borrower | Loan Amount |
|---|---|---|---|
| Open | Sanders Kathy Marie | $125,564 |
Source: Public Records
Tax History
| Year | Tax Paid | Tax Assessment Tax Assessment Total Assessment is a certain percentage of the fair market value that is determined by local assessors to be the total taxable value of land and additions on the property. | Land | Improvement |
|---|---|---|---|---|
| 2025 | $2,256 | $44,310 | $8,190 | $36,120 |
| 2024 | $2,413 | $44,310 | $8,190 | $36,120 |
| 2023 | $1,566 | $26,360 | $6,480 | $19,880 |
| 2022 | $1,565 | $26,360 | $6,480 | $19,880 |
| 2021 | $2,506 | $26,360 | $6,480 | $19,880 |
| 2020 | $2,108 | $19,950 | $4,900 | $15,050 |
| 2019 | $1,892 | $57,000 | $14,000 | $43,000 |
| 2018 | $1,951 | $19,950 | $4,900 | $15,050 |
| 2017 | $1,921 | $16,740 | $3,260 | $13,480 |
| 2016 | $989 | $16,740 | $3,260 | $13,480 |
| 2015 | $908 | $16,740 | $3,260 | $13,480 |
| 2014 | $908 | $16,740 | $3,260 | $13,480 |
Source: Public Records
Map
Nearby Homes
- 21481 Ball Ave
- 21181 Ball Ave
- 21391 Westport Ave
- 21670 Crystal Ave
- 21000 Crystal Ave
- 20931 Priday Ave
- 20900 Priday Ave
- 21051 Westport Ave
- 21051 S Lake Shore Blvd
- 21300 Wilmore Ave
- 21250 Wilmore Ave
- 21971 Crystal Ave
- 21170 Wilmore Ave
- 20700 Crystal Ave
- 20751 Wilmore Ave
- 20591 Ball Ave
- 20801 Morris Ave
- 20890 Morris Ave
- 273 E 208th St
- 20830 Tracy Ave
- 528 E 215th St
- 534 E 215th St
- 524 E 215th St
- 538 E 215th St
- 21441 Fuller Ave
- 21450 Priday Ave
- 21551 Fuller Ave
- 21421 Fuller Ave
- 21550 Priday Ave
- 21430 Priday Ave
- 21571 Fuller Ave
- 21570 Priday Ave
- 480 E 215th St
- 21401 Fuller Ave
- 21400 Priday Ave
- 21480 Fuller Ave
- 21494 Fuller Ave
- 21460 Fuller Ave
- 21550 Fuller Ave
- 21630 Priday Ave
Your Personal Tour Guide
Ask me questions while you tour the home.