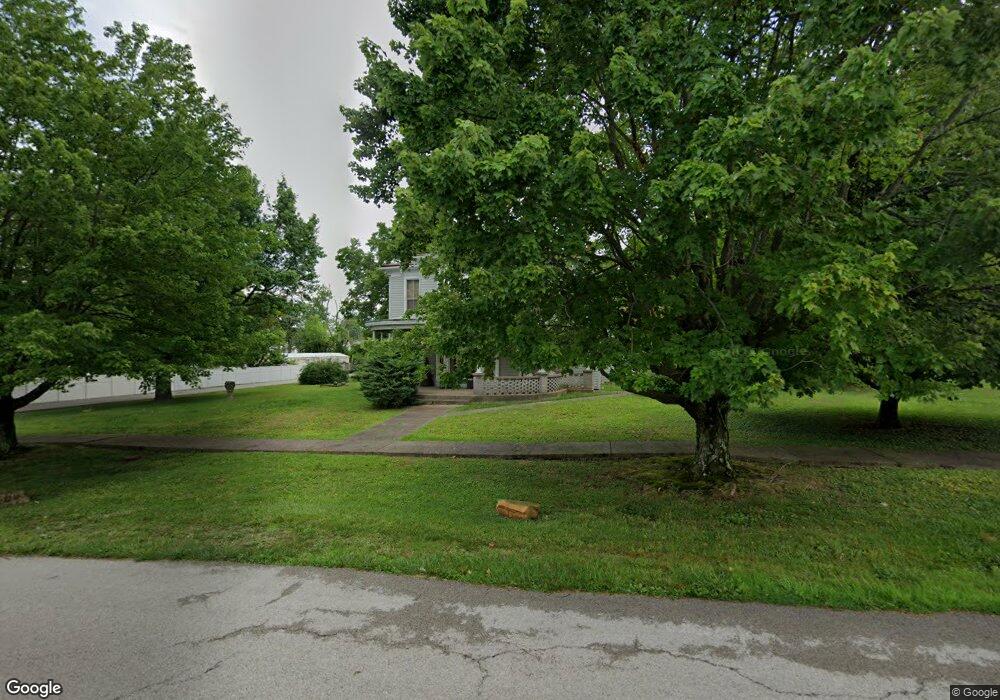
530 E Mulberry St West Union, OH 45693
Estimated Value: $147,069 - $201,000
4
Beds
1
Bath
1,952
Sq Ft
$86/Sq Ft
Est. Value
About This Home
This home is located at 530 E Mulberry St, West Union, OH 45693 and is currently estimated at $168,517, approximately $86 per square foot. 530 E Mulberry St is a home located in Adams County with nearby schools including West Union Elementary School, West Union High School, and Adams County Christian School.
Ownership History
Date
Name
Owned For
Owner Type
Purchase Details
Closed on
May 15, 2018
Sold by
Bayless Helen P and Bayless Richard C
Bought by
Taylor Christine
Current Estimated Value
Home Financials for this Owner
Home Financials are based on the most recent Mortgage that was taken out on this home.
Original Mortgage
$32,000
Outstanding Balance
$27,578
Interest Rate
4.44%
Mortgage Type
Seller Take Back
Estimated Equity
$140,939
Purchase Details
Closed on
May 14, 2018
Sold by
Young Valerie
Bought by
Bayless Helen P and Bayless Richard C
Home Financials for this Owner
Home Financials are based on the most recent Mortgage that was taken out on this home.
Original Mortgage
$32,000
Outstanding Balance
$27,578
Interest Rate
4.44%
Mortgage Type
Seller Take Back
Estimated Equity
$140,939
Purchase Details
Closed on
Feb 19, 2004
Sold by
Young Valerie
Bought by
Young Valerie
Purchase Details
Closed on
Jan 1, 1990
Bought by
Young Valerie
Create a Home Valuation Report for This Property
The Home Valuation Report is an in-depth analysis detailing your home's value as well as a comparison with similar homes in the area
Home Values in the Area
Average Home Value in this Area
Purchase History
| Date | Buyer | Sale Price | Title Company |
|---|---|---|---|
| Taylor Christine | $84,000 | None Available | |
| Bayless Helen P | -- | -- | |
| Young Valerie | -- | -- | |
| Young Valerie | -- | -- |
Source: Public Records
Mortgage History
| Date | Status | Borrower | Loan Amount |
|---|---|---|---|
| Open | Taylor Christine | $32,000 |
Source: Public Records
Tax History Compared to Growth
Tax History
| Year | Tax Paid | Tax Assessment Tax Assessment Total Assessment is a certain percentage of the fair market value that is determined by local assessors to be the total taxable value of land and additions on the property. | Land | Improvement |
|---|---|---|---|---|
| 2024 | $1,316 | $35,110 | $6,340 | $28,770 |
| 2023 | $1,324 | $35,110 | $6,340 | $28,770 |
| 2022 | $1,210 | $28,430 | $4,800 | $23,630 |
| 2021 | $1,059 | $28,430 | $4,800 | $23,630 |
| 2020 | $1,083 | $28,430 | $4,800 | $23,630 |
| 2019 | $1,083 | $28,430 | $4,800 | $23,630 |
| 2018 | $1,005 | $25,350 | $4,800 | $20,550 |
| 2017 | $631 | $25,350 | $4,800 | $20,550 |
| 2016 | $630 | $25,350 | $4,800 | $20,550 |
| 2015 | $442 | $20,760 | $4,800 | $15,960 |
| 2014 | $442 | $20,760 | $4,800 | $15,960 |
Source: Public Records
Map
Nearby Homes
- 601 E Main St
- 501 E Mulberry St
- 526 E Walnut St
- 104 N Washington St
- 618 Maple St
- 3188 Ohio 125
- 725 E Walnut St
- 70 Logans Ln
- 204 E North St
- 537 1st St
- 12196 State Route 41
- 585 High St
- 216 S Market St
- 302 W Main St
- 305 W Walnut St
- 175 Hidden Acres Dr
- 1082 E Walnut St
- 4700 Ohio 247
- 101 S Mound St
- 286 & 290 S Market St
- 531 E Mulberry St
- 521 E Mulberry St
- 518 E Mulberry St
- 515 E Mulberry St
- 509 E Mulberry St
- 612 E Mulberry St
- 309 Maple St
- 523 E North St
- 316 Maple St
- 529 E North St
- 310 Boyd Ave
- 535 E North St
- 607 E Main St
- 522 E North St
- 603 E North St
- 309 Boyd Ave
- 530 E North St
- 438 E Mulberry St
- 534 E North St
- 319 Boyd Ave