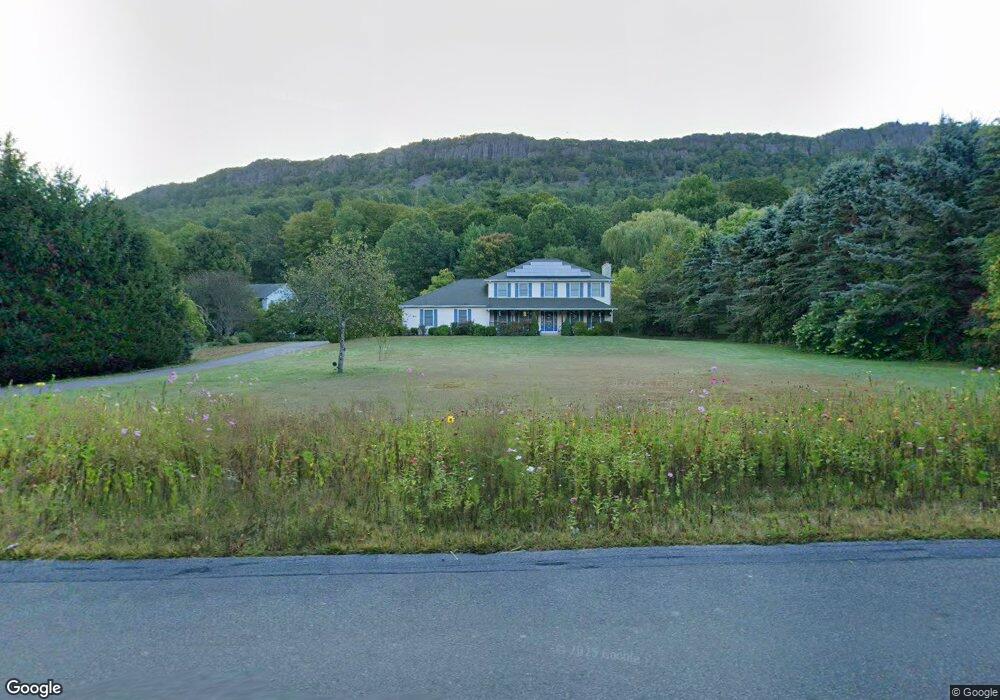
530 East St Easthampton, MA 01027
Estimated Value: $591,000 - $858,000
4
Beds
3
Baths
2,660
Sq Ft
$270/Sq Ft
Est. Value
About This Home
This home is located at 530 East St, Easthampton, MA 01027 and is currently estimated at $717,958, approximately $269 per square foot. 530 East St is a home located in Hampshire County with nearby schools including Easthampton High School, Tri-County Schools, and New England Adolescent Research Institute.
Ownership History
Date
Name
Owned For
Owner Type
Purchase Details
Closed on
Nov 18, 2009
Sold by
Fedor Edward C and Fedor Helen
Bought by
Lagana Jason and Brown Laurie
Current Estimated Value
Home Financials for this Owner
Home Financials are based on the most recent Mortgage that was taken out on this home.
Original Mortgage
$336,000
Interest Rate
4.86%
Mortgage Type
Purchase Money Mortgage
Purchase Details
Closed on
Jul 25, 1996
Sold by
Charles Edward Rt and Fedor Charles M
Bought by
Fedor Edward C and Fedor Helen
Create a Home Valuation Report for This Property
The Home Valuation Report is an in-depth analysis detailing your home's value as well as a comparison with similar homes in the area
Home Values in the Area
Average Home Value in this Area
Purchase History
| Date | Buyer | Sale Price | Title Company |
|---|---|---|---|
| Lagana Jason | $420,000 | -- | |
| Fedor Edward C | $18,000 | -- |
Source: Public Records
Mortgage History
| Date | Status | Borrower | Loan Amount |
|---|---|---|---|
| Open | Fedor Edward C | $310,700 | |
| Closed | Lagana Jason | $336,000 |
Source: Public Records
Tax History Compared to Growth
Tax History
| Year | Tax Paid | Tax Assessment Tax Assessment Total Assessment is a certain percentage of the fair market value that is determined by local assessors to be the total taxable value of land and additions on the property. | Land | Improvement |
|---|---|---|---|---|
| 2025 | $8,631 | $631,400 | $125,400 | $506,000 |
| 2024 | $8,322 | $613,700 | $121,800 | $491,900 |
| 2023 | $6,417 | $438,000 | $96,700 | $341,300 |
| 2022 | $7,240 | $438,000 | $96,700 | $341,300 |
| 2021 | $8,009 | $456,600 | $96,700 | $359,900 |
| 2020 | $7,779 | $438,000 | $96,700 | $341,300 |
| 2019 | $6,657 | $430,600 | $96,700 | $333,900 |
| 2018 | $6,389 | $399,300 | $91,300 | $308,000 |
| 2017 | $6,233 | $384,500 | $87,700 | $296,800 |
| 2016 | $5,994 | $384,500 | $87,700 | $296,800 |
| 2015 | $5,825 | $384,500 | $87,700 | $296,800 |
Source: Public Records
Map
Nearby Homes
- 78 Holyoke St
- 5 Lownds Ave
- 52 Williston Ave
- 33 Knipfer Ave
- 4 Laurel Dr
- 108 Parsons St
- 52-54 Everett St
- 19 Nicols Way Unit 19
- 98 Everett St
- 6 S St & Abutting Lots
- 16 Bayberry Dr
- 125 Park St
- 2 Clinton St
- 245 Park St
- 13 Golden Dr
- 41 South St Unit 11
- 119 Central Park Dr
- 12 Glen Cove Place Unit B
- 10 Glen Cove Place Unit A
- 179 Central Park Dr