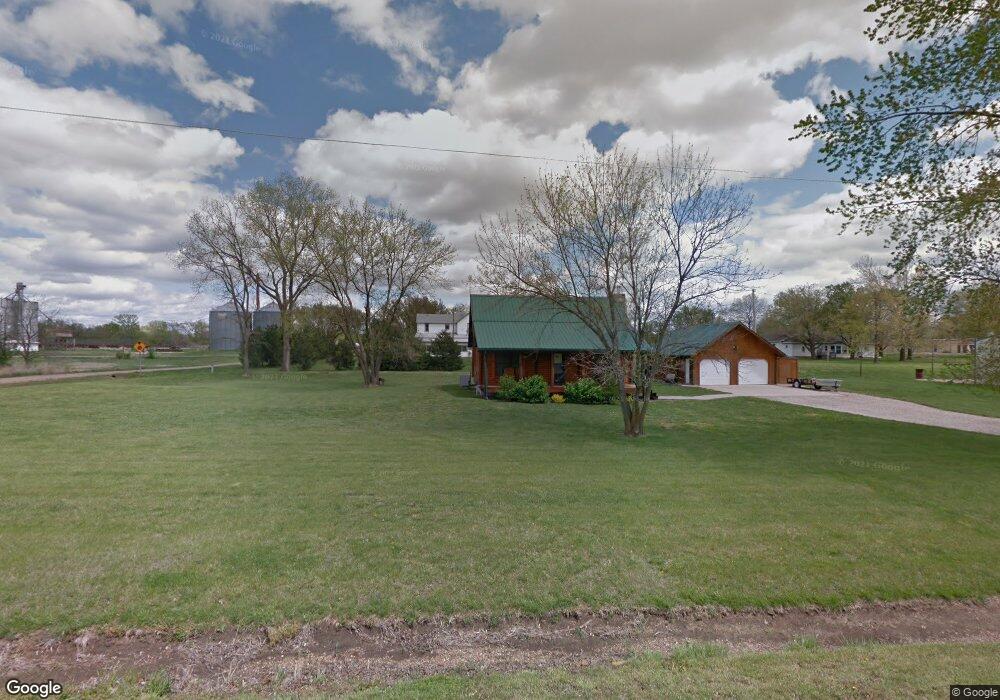
530 Exchange St Neosho Rapids, KS 66864
Estimated Value: $85,000 - $184,271
3
Beds
2
Baths
914
Sq Ft
$154/Sq Ft
Est. Value
About This Home
This home is located at 530 Exchange St, Neosho Rapids, KS 66864 and is currently estimated at $140,757, approximately $154 per square foot. 530 Exchange St is a home located in Lyon County with nearby schools including Neosho Rapids Elementary School and Hartford/Neosho Rapids Junior/Senior High School.
Ownership History
Date
Name
Owned For
Owner Type
Purchase Details
Closed on
May 8, 2019
Sold by
Parsons Matt A and Parsons Cara
Bought by
Miller Kathryn L
Current Estimated Value
Home Financials for this Owner
Home Financials are based on the most recent Mortgage that was taken out on this home.
Original Mortgage
$138,700
Outstanding Balance
$121,698
Interest Rate
4.1%
Mortgage Type
New Conventional
Estimated Equity
$19,059
Purchase Details
Closed on
Jul 16, 2015
Sold by
Grossenbacher Rick J and Grossenbacher Kelly A
Bought by
Parsons Matt and Parsons Cara
Home Financials for this Owner
Home Financials are based on the most recent Mortgage that was taken out on this home.
Original Mortgage
$98,188
Interest Rate
4.12%
Mortgage Type
FHA
Purchase Details
Closed on
May 1, 2005
Bought by
Grossenbacher Rick J and Grossenbacher Kelly A
Create a Home Valuation Report for This Property
The Home Valuation Report is an in-depth analysis detailing your home's value as well as a comparison with similar homes in the area
Home Values in the Area
Average Home Value in this Area
Purchase History
| Date | Buyer | Sale Price | Title Company |
|---|---|---|---|
| Miller Kathryn L | $173,375 | -- | |
| Parsons Matt | $99,169 | Nationwide Title Clearing Inc | |
| Grossenbacher Rick J | $1,750 | -- |
Source: Public Records
Mortgage History
| Date | Status | Borrower | Loan Amount |
|---|---|---|---|
| Open | Miller Kathryn L | $138,700 | |
| Previous Owner | Parsons Matt | $98,188 |
Source: Public Records
Tax History Compared to Growth
Tax History
| Year | Tax Paid | Tax Assessment Tax Assessment Total Assessment is a certain percentage of the fair market value that is determined by local assessors to be the total taxable value of land and additions on the property. | Land | Improvement |
|---|---|---|---|---|
| 2025 | $2,751 | $18,446 | $486 | $17,960 |
| 2024 | $2,751 | $18,585 | $486 | $18,099 |
| 2023 | $2,831 | $18,585 | $421 | $18,164 |
| 2022 | $2,465 | $16,859 | $421 | $16,438 |
| 2021 | $2,579 | $17,227 | $536 | $16,691 |
| 2020 | $2,176 | $16,928 | $274 | $16,654 |
| 2019 | $2,176 | $13,719 | $231 | $13,488 |
| 2018 | $2,156 | $13,374 | $256 | $13,118 |
| 2017 | $2,084 | $12,708 | $337 | $12,371 |
| 2016 | $1,877 | $11,857 | $337 | $11,520 |
| 2015 | -- | $12,240 | $337 | $11,903 |
| 2014 | -- | $10,644 | $419 | $10,225 |
Source: Public Records
Map
Nearby Homes
- 2016 Road 170
- 0 Blackbird Rd
- 0 Park Ave Unit HMS2560137
- 315 E Park Ave
- 415 E Park Ave
- 1251 25th Rd
- 403 W Broadway St
- 417 W 5th St
- 0 Road N
- 214 W 5th St
- 0 S Davis Rd
- 1020 Wanamaka Rd
- 000 Fauna Rd
- 1830 E 6th Ave
- 500 Whildin St
- 1031 Sunrise Dr
- 520 Eveningside Dr
- 413 Eveningside Dr
- 924 E South Ave
- 918 E Logan Ave