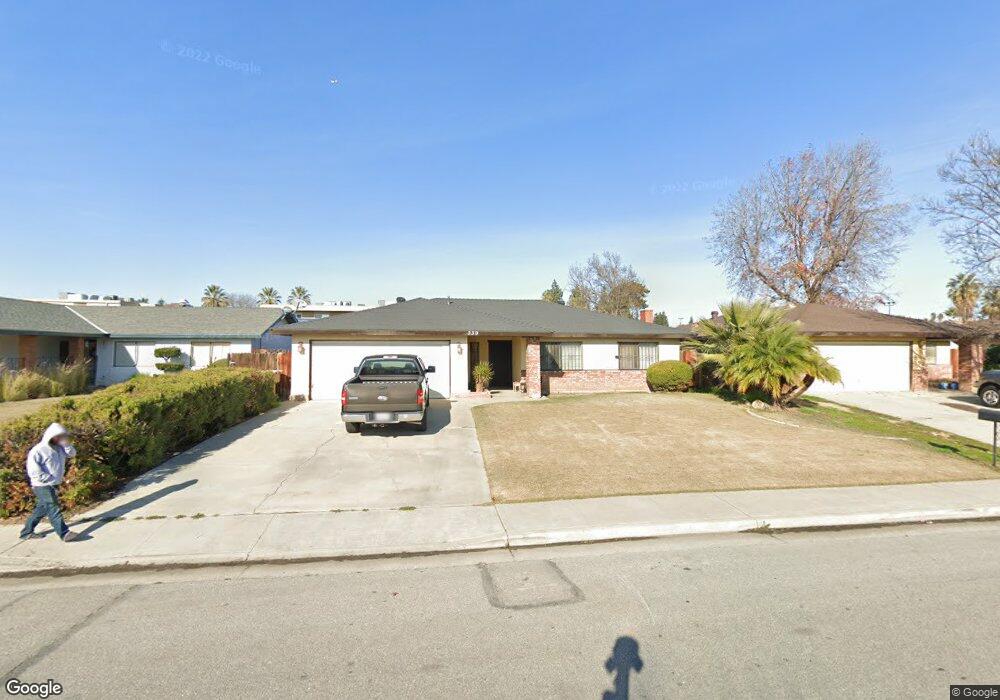
530 Francis St Bakersfield, CA 93308
North Country Meadows NeighborhoodEstimated Value: $284,512 - $308,000
3
Beds
2
Baths
1,448
Sq Ft
$208/Sq Ft
Est. Value
About This Home
This home is located at 530 Francis St, Bakersfield, CA 93308 and is currently estimated at $301,128, approximately $207 per square foot. 530 Francis St is a home located in Kern County with nearby schools including Wingland Elementary School, Standard Middle School, and North High School.
Ownership History
Date
Name
Owned For
Owner Type
Purchase Details
Closed on
Jun 28, 2001
Sold by
Hollinsworth Lorreta B
Bought by
Garretson John T and Garretson Carolyn K
Current Estimated Value
Home Financials for this Owner
Home Financials are based on the most recent Mortgage that was taken out on this home.
Original Mortgage
$75,950
Outstanding Balance
$29,184
Interest Rate
7.1%
Estimated Equity
$271,944
Create a Home Valuation Report for This Property
The Home Valuation Report is an in-depth analysis detailing your home's value as well as a comparison with similar homes in the area
Home Values in the Area
Average Home Value in this Area
Purchase History
| Date | Buyer | Sale Price | Title Company |
|---|---|---|---|
| Garretson John T | $95,000 | Fidelity National Title Co |
Source: Public Records
Mortgage History
| Date | Status | Borrower | Loan Amount |
|---|---|---|---|
| Open | Garretson John T | $75,950 |
Source: Public Records
Tax History Compared to Growth
Tax History
| Year | Tax Paid | Tax Assessment Tax Assessment Total Assessment is a certain percentage of the fair market value that is determined by local assessors to be the total taxable value of land and additions on the property. | Land | Improvement |
|---|---|---|---|---|
| 2025 | $2,566 | $140,318 | $29,533 | $110,785 |
| 2024 | $2,477 | $137,567 | $28,954 | $108,613 |
| 2023 | $2,477 | $134,871 | $28,387 | $106,484 |
| 2022 | $2,393 | $132,228 | $27,831 | $104,397 |
| 2021 | $2,300 | $129,636 | $27,286 | $102,350 |
| 2020 | $2,210 | $128,308 | $27,007 | $101,301 |
| 2019 | $2,181 | $128,308 | $27,007 | $101,301 |
| 2018 | $2,102 | $123,327 | $25,959 | $97,368 |
| 2017 | $2,086 | $120,909 | $25,450 | $95,459 |
| 2016 | $1,920 | $118,539 | $24,951 | $93,588 |
| 2015 | $1,892 | $116,760 | $24,577 | $92,183 |
| 2014 | $1,850 | $114,474 | $24,096 | $90,378 |
Source: Public Records
Map
Nearby Homes
- 532 Francis St
- 2107 Mccray St
- 606 Charlana Dr
- 604 Francis St
- 428 Francis St
- 431 Douglas St
- 439 Arvin St
- 425 W China Grade Loop
- 419 W China Grade Loop
- 413 W China Grade Loop
- 2132 Wingland Dr
- 505 Linda Vista Dr
- 407 W China Grade Loop
- 602 Ann Arbor Dr
- 1909 Margo Ln
- 2112 Wingland Dr
- 443 Linda Vista Dr
- 633 Sun Rose Ave
- 513 Sun Rose Ave
- 327 Douglas St
- 528 Francis St
- 534 Francis St
- 526 Francis St
- 529 Francis St
- 531 Francis St
- 527 Francis St
- 536 Francis St
- 524 Francis St
- 533 Francis St
- 525 Francis St
- 535 Francis St
- 522 Francis St
- 538 Francis St
- 528 Charlana Dr
- 530 Charlana Dr
- 523 Francis St
- 526 Charlana Dr
- 532 Charlana Dr
- 537 Francis St
- 524 Charlana Dr