
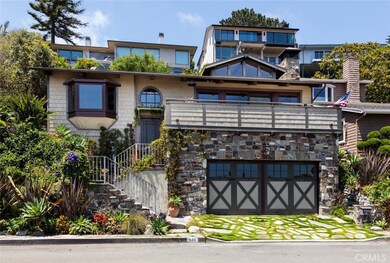
530 High Dr Laguna Beach, CA 92651
North Laguna NeighborhoodEstimated payment $18,390/month
Highlights
- Ocean View
- Primary Bedroom Suite
- Vaulted Ceiling
- El Morro Elementary School Rated A+
- Craftsman Architecture
- Main Floor Bedroom
About This Home
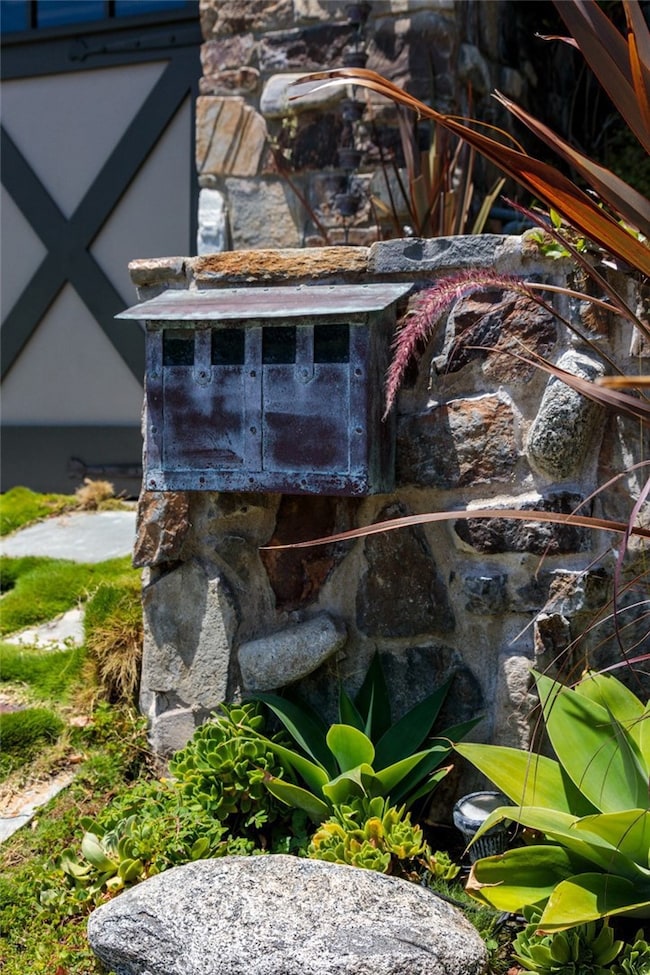
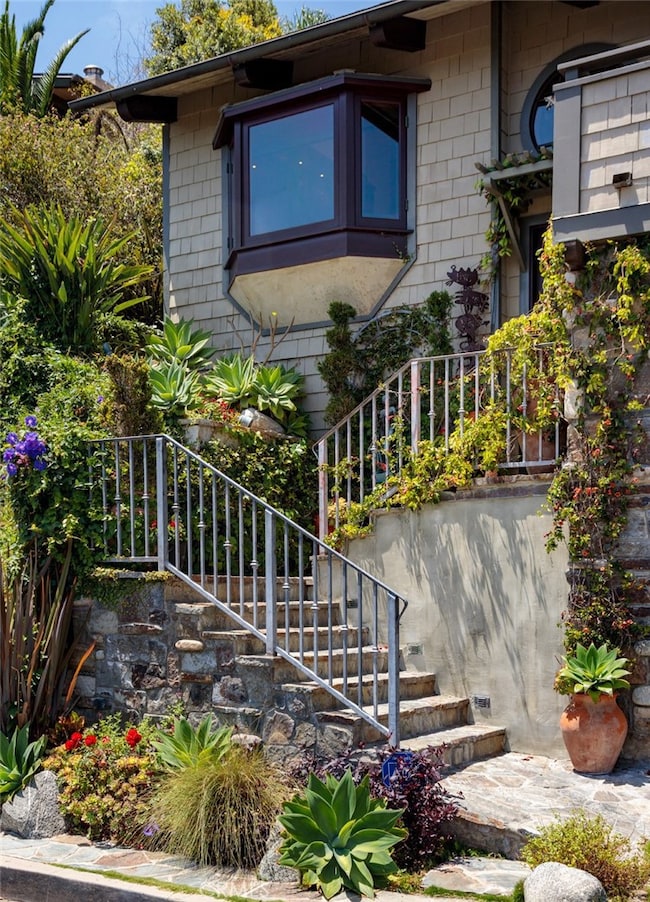
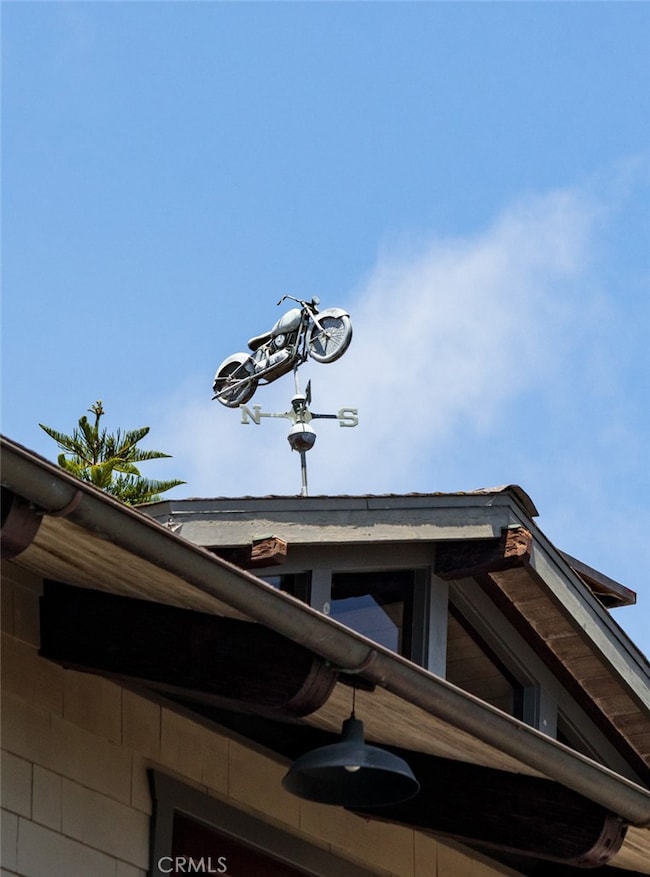
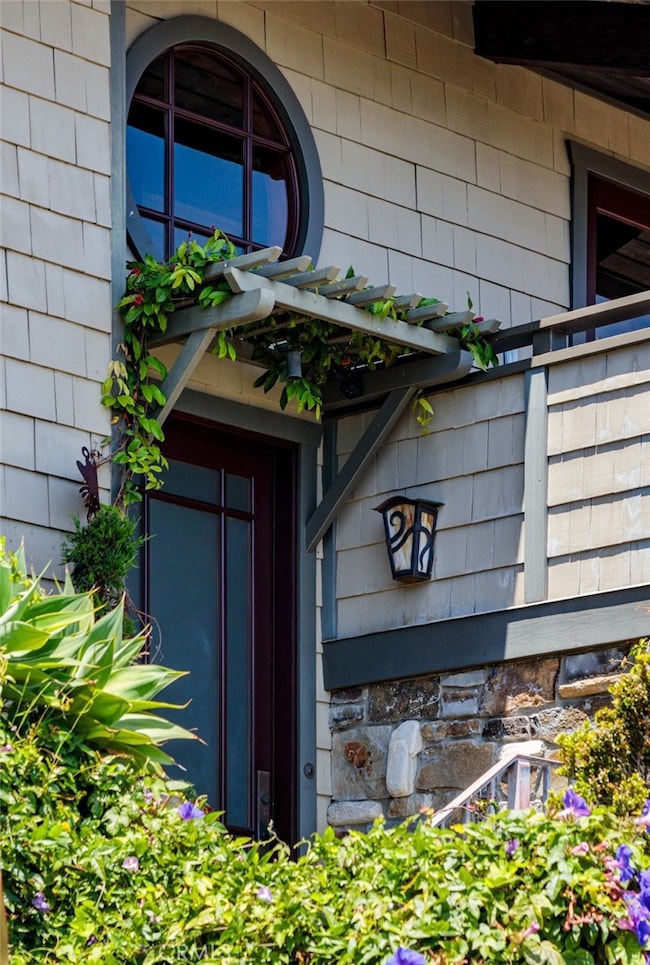
Tucked along one of North Laguna Beach’s most picturesque streets, 530 High Drive is a study in thoughtful design, timeless materials, and bespoke coastal charm. With sweeping ocean and Catalina Island views from nearly every room—and a garden landscape that feels curated rather than planted—this coastal residence balances architectural integrity with relaxed elegance, all while presenting an exceptional opportunity for future expansion. The home’s exterior—a patchwork of earth-toned shingles, copper accents, custom handmade fixtures by local artisans, and lush botanicals—hints at what lies within: a series of warm, light-filled rooms where craftsmanship takes center stage. Vaulted, beamed ceilings and real hardwood floors lend a sense of quiet luxury, while walls of windows draw the eye toward the Pacific. At the heart of the home, a gracious living room is anchored by a Franklin stove wood-burning fireplace and opens through sliding glass doors to a large ocean-facing deck designed for sunset viewing and outdoor entertaining. The adjacent kitchen is both refined and personal, featuring custom cabinetry and copper detailing. The private primary suite is tucked into the rear of the home and enjoys tranquil garden vistas, while a west-facing secondary bedroom captures cinematic sunsets and features a cozy loft space—perfect for guests or creative retreat. A lower-level bonus room with office area offers versatile utility, easily adaptable as a studio or gym. An attached two-car garage with direct interior access—a true rarity in Laguna Beach—adds both convenience and additional storage space. But it’s the landscape—enhanced by award-winning landscape architect Ruben Flores—that completes the narrative. A terraced rear garden unfolds in vignettes: a mosaic patio for dining, meandering stone paths, mature fruit trees, and a firepit lounge perched at the top of the lot with a breathtaking coastal panorama. Ideally situated toward the front of the lot, the property offers development opportunity—whether as a foundation for expansion, the addition of an ADU, or a reimagined estate. Just moments from Laguna Beach art galleries, iconic beaches, and historic Heisler Park, 530 High Drive is more than a home—it’s a lifestyle.
Listing Agent
Compass Brokerage Phone: 949-447-4444 License #01969131 Listed on: 06/25/2025

Home Details
Home Type
- Single Family
Est. Annual Taxes
- $6,166
Year Built
- Built in 1973
Lot Details
- 5,500 Sq Ft Lot
- Density is up to 1 Unit/Acre
Parking
- 2 Car Attached Garage
Property Views
- Ocean
- Catalina
- Panoramic
Home Design
- Craftsman Architecture
- Entry on the 2nd floor
Interior Spaces
- 1,440 Sq Ft Home
- 3-Story Property
- Vaulted Ceiling
- Wood Burning Fireplace
- Great Room
- Living Room with Fireplace
- Loft
Bedrooms and Bathrooms
- 2 Bedrooms | 1 Main Level Bedroom
- All Upper Level Bedrooms
- Primary Bedroom Suite
- 2 Full Bathrooms
Laundry
- Laundry Room
- Laundry in Garage
Additional Features
- Exterior Lighting
- Central Heating and Cooling System
Listing and Financial Details
- Legal Lot and Block 37 / F
- Tax Tract Number 188
- Assessor Parcel Number 49604139
- $987 per year additional tax assessments
- Seller Considering Concessions
Community Details
Overview
- No Home Owners Association
- North Laguna Subdivision
Recreation
- Hiking Trails
- Bike Trail
Map
Home Values in the Area
Average Home Value in this Area
Tax History
| Year | Tax Paid | Tax Assessment Tax Assessment Total Assessment is a certain percentage of the fair market value that is determined by local assessors to be the total taxable value of land and additions on the property. | Land | Improvement |
|---|---|---|---|---|
| 2025 | $6,166 | $527,136 | $379,248 | $147,888 |
| 2024 | $6,166 | $516,800 | $371,811 | $144,989 |
| 2023 | $6,320 | $506,667 | $364,520 | $142,147 |
| 2022 | $6,140 | $496,733 | $357,373 | $139,360 |
| 2021 | $5,962 | $486,994 | $350,366 | $136,628 |
| 2020 | $5,834 | $482,001 | $346,773 | $135,228 |
| 2019 | $5,708 | $472,550 | $339,973 | $132,577 |
| 2018 | $5,581 | $463,285 | $333,307 | $129,978 |
| 2017 | $5,450 | $454,201 | $326,771 | $127,430 |
| 2016 | $6,280 | $445,296 | $320,364 | $124,932 |
| 2015 | $6,938 | $438,608 | $315,552 | $123,056 |
| 2014 | $6,721 | $430,017 | $309,371 | $120,646 |
Property History
| Date | Event | Price | List to Sale | Price per Sq Ft |
|---|---|---|---|---|
| 06/25/2025 06/25/25 | For Sale | $3,395,000 | -- | $2,358 / Sq Ft |
Purchase History
| Date | Type | Sale Price | Title Company |
|---|---|---|---|
| Interfamily Deed Transfer | -- | Lsi | |
| Interfamily Deed Transfer | -- | None Available | |
| Interfamily Deed Transfer | -- | Fidelity National Title Co | |
| Interfamily Deed Transfer | -- | -- |
Mortgage History
| Date | Status | Loan Amount | Loan Type |
|---|---|---|---|
| Closed | $406,000 | New Conventional | |
| Closed | $250,000 | No Value Available |
Source: California Regional Multiple Listing Service (CRMLS)
MLS Number: LG25141925
APN: 496-041-39
Disclaimer: Certain information contained herein is derived from information provided by parties other than Homes.com. All information provided is deemed reliable, but is not guaranteed to be accurate and should be independently verified.
![]() The multiple listing data appearing on this website, or contained in reports produced therefrom, is owned and copyrighted by California Regional Multiple Listing Service, Inc. ("CRMLS") and is protected by all applicable copyright laws. Information provided is for viewer's personal, non-commercial use and may not be used for any purpose other than to identify prospective properties the viewer may be interested in purchasing. All listing data, including but not limited to square footage and lot size is believed to be accurate, but the listing Agent, listing Broker and CRMLS and its affiliates do not warrant or guarantee such accuracy. The viewer should independently verify the listed data prior to making any decisions based on such information by personal inspection and/or contacting a real estate professional.
The multiple listing data appearing on this website, or contained in reports produced therefrom, is owned and copyrighted by California Regional Multiple Listing Service, Inc. ("CRMLS") and is protected by all applicable copyright laws. Information provided is for viewer's personal, non-commercial use and may not be used for any purpose other than to identify prospective properties the viewer may be interested in purchasing. All listing data, including but not limited to square footage and lot size is believed to be accurate, but the listing Agent, listing Broker and CRMLS and its affiliates do not warrant or guarantee such accuracy. The viewer should independently verify the listed data prior to making any decisions based on such information by personal inspection and/or contacting a real estate professional.
Based on information from California Regional Multiple Listing Service, Inc. and /or other sources. All data, including all measurements and calculations of area, is obtained from various sources and has not been, and will not be, verified by broker or MLS. All information should be independently reviewed and verified for accuracy. Properties may or may not be listed by the office/agent presenting the information
- 535 High Dr
- 455 Bonvue Terrace
- 22691 Allview Terrace
- 625 High Dr
- 310 Hawthorne Rd
- 432 Holly St
- 520 Cliff Dr Unit 304
- 339 Cypress Dr
- 990 Hillcrest Dr
- 716 Cliff Dr
- 738 Cliff Dr
- 253 Fairview St
- 222 Wave St
- 247 Fairview St
- 481 Dartmoor St
- 246 Fairview St
- 1105 N Coast Hwy
- 1041 Marine Dr
- 114 High Dr
- 134 High Dr
- 570 Allview Terrace
- 612 Allview Place
- 388 Hawthorne Rd Unit A
- 334 Locust St Unit 2
- 310 Hawthorne Rd
- 552 Cypress Dr Unit A
- 464 Holly St
- 372 1/2 Jasmine St
- 432 Holly St
- 265 Myrtle St Unit A
- 252 Grandview St Unit B
- 252 Grandview St
- 220 Grandview St Unit A
- 206 Grandview St
- 432 N Coast Hwy Unit B
- 243 Wave St
- 241 Wave St
- 283 Fairview St
- 335 Cypress Dr
- 462 Cliff Dr