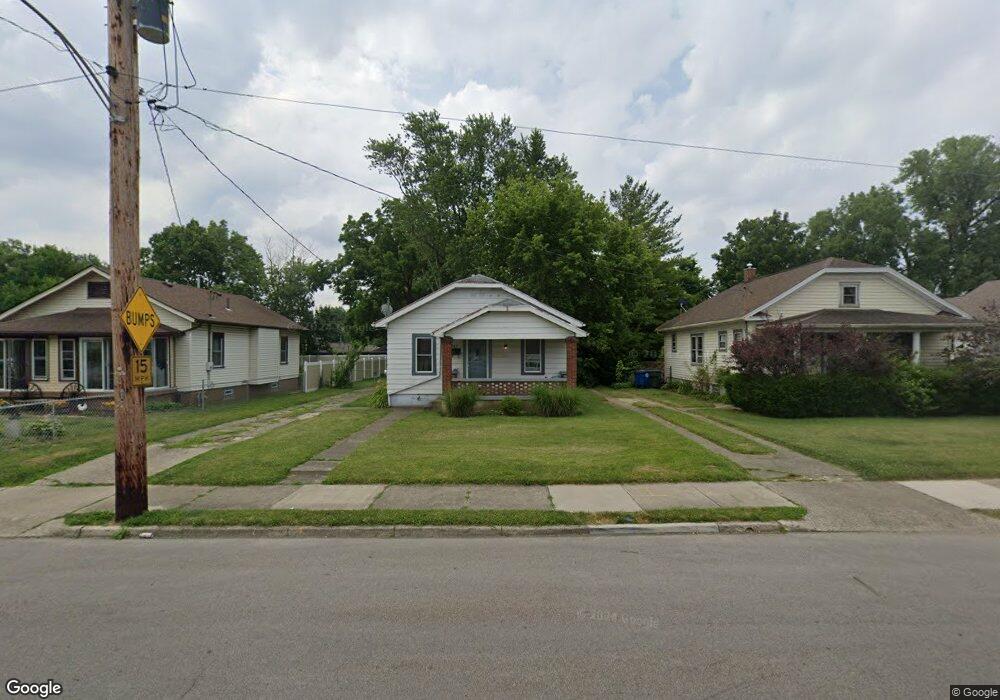
530 Morse Ave Dayton, OH 45420
Belmont NeighborhoodEstimated Value: $99,000 - $156,000
2
Beds
1
Bath
884
Sq Ft
$150/Sq Ft
Est. Value
About This Home
This home is located at 530 Morse Ave, Dayton, OH 45420 and is currently estimated at $133,040, approximately $150 per square foot. 530 Morse Ave is a home located in Montgomery County with nearby schools including Horace Mann Elementary School, Cleveland Elementary School, and Eastmont Elementary.
Ownership History
Date
Name
Owned For
Owner Type
Purchase Details
Closed on
Jul 6, 2018
Sold by
Holbrook Ethel
Bought by
Rb Realty Llc
Current Estimated Value
Purchase Details
Closed on
Dec 4, 2001
Sold by
Brown Russell B
Bought by
Brown Virgil C and Brown Martha C
Home Financials for this Owner
Home Financials are based on the most recent Mortgage that was taken out on this home.
Original Mortgage
$48,000
Interest Rate
6.68%
Create a Home Valuation Report for This Property
The Home Valuation Report is an in-depth analysis detailing your home's value as well as a comparison with similar homes in the area
Home Values in the Area
Average Home Value in this Area
Purchase History
| Date | Buyer | Sale Price | Title Company |
|---|---|---|---|
| Rb Realty Llc | $295,000 | Home Services Title Llc | |
| Brown Virgil C | $60,000 | -- |
Source: Public Records
Mortgage History
| Date | Status | Borrower | Loan Amount |
|---|---|---|---|
| Previous Owner | Brown Virgil C | $48,000 |
Source: Public Records
Tax History Compared to Growth
Tax History
| Year | Tax Paid | Tax Assessment Tax Assessment Total Assessment is a certain percentage of the fair market value that is determined by local assessors to be the total taxable value of land and additions on the property. | Land | Improvement |
|---|---|---|---|---|
| 2024 | $1,758 | $30,430 | $11,190 | $19,240 |
| 2023 | $1,758 | $30,430 | $11,190 | $19,240 |
| 2022 | $1,578 | $21,100 | $7,770 | $13,330 |
| 2021 | $1,570 | $21,100 | $7,770 | $13,330 |
| 2020 | $1,567 | $21,100 | $7,770 | $13,330 |
| 2019 | $1,670 | $20,240 | $8,630 | $11,610 |
| 2018 | $1,672 | $20,240 | $8,630 | $11,610 |
| 2017 | $1,660 | $20,240 | $8,630 | $11,610 |
| 2016 | $1,676 | $19,430 | $8,630 | $10,800 |
| 2015 | $1,586 | $19,430 | $8,630 | $10,800 |
| 2014 | $1,586 | $19,430 | $8,630 | $10,800 |
| 2012 | -- | $22,770 | $8,470 | $14,300 |
Source: Public Records
Map
Nearby Homes
- 2637 Westfield Ave
- 434 Bellaire Ave
- 2538 Mundale Ave
- 2520 Westfield Ave
- 525 Watervliet Ave
- 2242 Nill Ave
- 826 Bellaire Ave
- 3125 Cottage Terrace
- 622 Watervliet Ave
- 2229 Nill Ave
- 1025 Morse Ave
- 150 Nordale Ave
- 2900 Lansing Dr
- 2225 King Ave
- 2413 S Smithville Rd
- 2417 S Smithville Rd
- 3618 Woodbine Ave
- 3605 Woodbine Ave
- 819 Chelsea Ave
- 1029 Wilmington Ave