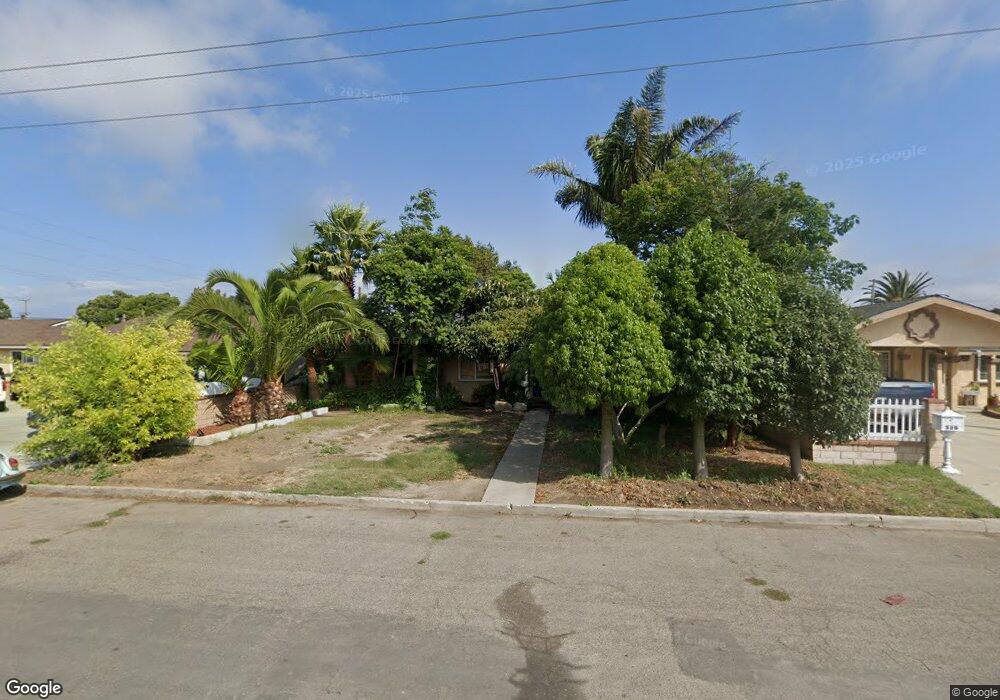
530 N E St Lompoc, CA 93436
Estimated Value: $500,000 - $578,000
4
Beds
3
Baths
1,817
Sq Ft
$298/Sq Ft
Est. Value
About This Home
This home is located at 530 N E St, Lompoc, CA 93436 and is currently estimated at $541,016, approximately $297 per square foot. 530 N E St is a home located in Santa Barbara County with nearby schools including La Honda STEAM Academy, Cabrillo High School, and Olive Grove Charter - Lompoc.
Ownership History
Date
Name
Owned For
Owner Type
Purchase Details
Closed on
Feb 26, 2018
Sold by
Brian Thomas O and Brian Frances
Bought by
Macias Raoul M
Current Estimated Value
Home Financials for this Owner
Home Financials are based on the most recent Mortgage that was taken out on this home.
Original Mortgage
$148,117
Outstanding Balance
$127,074
Interest Rate
4.43%
Mortgage Type
VA
Estimated Equity
$413,942
Purchase Details
Closed on
Nov 14, 2007
Sold by
Brian Thomas O and Brian Frances
Bought by
Brian Thomas O and Brian Frances
Create a Home Valuation Report for This Property
The Home Valuation Report is an in-depth analysis detailing your home's value as well as a comparison with similar homes in the area
Home Values in the Area
Average Home Value in this Area
Purchase History
| Date | Buyer | Sale Price | Title Company |
|---|---|---|---|
| Macias Raoul M | $145,000 | Fidelity National Title Co | |
| Brian Thomas O | -- | None Available |
Source: Public Records
Mortgage History
| Date | Status | Borrower | Loan Amount |
|---|---|---|---|
| Open | Macias Raoul M | $148,117 |
Source: Public Records
Tax History
| Year | Tax Paid | Tax Assessment Tax Assessment Total Assessment is a certain percentage of the fair market value that is determined by local assessors to be the total taxable value of land and additions on the property. | Land | Improvement |
|---|---|---|---|---|
| 2025 | $4,098 | $375,478 | $102,402 | $273,076 |
| 2023 | $4,098 | $360,900 | $98,427 | $262,473 |
| 2022 | $4,028 | $353,825 | $96,498 | $257,327 |
| 2021 | $4,073 | $346,888 | $94,606 | $252,282 |
| 2020 | $4,030 | $343,332 | $93,636 | $249,696 |
| 2019 | $3,964 | $336,600 | $91,800 | $244,800 |
| 2018 | $1,629 | $135,582 | $21,446 | $114,136 |
| 2017 | $1,599 | $132,925 | $21,026 | $111,899 |
| 2016 | $1,570 | $130,319 | $20,614 | $109,705 |
| 2014 | $1,537 | $125,850 | $19,908 | $105,942 |
Source: Public Records
Map
Nearby Homes
- 533 N G St
- 610 E Pine Ave Unit 10
- 610 E Pine Ave Unit 29
- 610 E Pine Ave Unit 62
- 622 N B St
- 510 N I St
- 505 N 1st St
- 701 E Pine Ave Unit 182
- 701 E Pine Ave Unit 176
- 701 E Pine Ave Unit 171
- 701 E Pine Ave Unit 161
- 516 N 2nd St
- 526 N L St
- 321 N Third St
- 801, 851 California 246
- 240 Quail Cir
- 117 S I St
- 205 S E St
- 321 W North Ave Unit 133
- 217 N M St
Your Personal Tour Guide
Ask me questions while you tour the home.