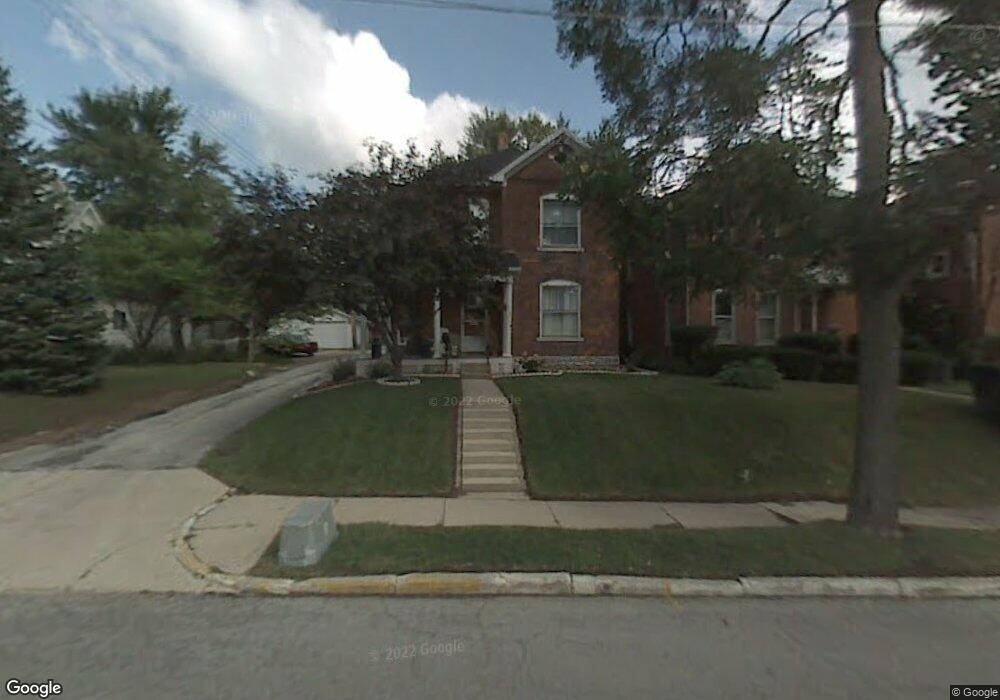
530 N West Ave Sidney, OH 45365
Estimated Value: $161,000 - $184,000
4
Beds
2
Baths
1,925
Sq Ft
$89/Sq Ft
Est. Value
About This Home
This home is located at 530 N West Ave, Sidney, OH 45365 and is currently estimated at $171,468, approximately $89 per square foot. 530 N West Ave is a home located in Shelby County with nearby schools including Sidney High School, Holy Angels Catholic School, and Christian Academy Schools.
Ownership History
Date
Name
Owned For
Owner Type
Purchase Details
Closed on
Nov 26, 2013
Sold by
Thurber Darryl E and Thurber Danielle L
Bought by
Thurber Darryl E and Thurber Danielle L
Current Estimated Value
Home Financials for this Owner
Home Financials are based on the most recent Mortgage that was taken out on this home.
Original Mortgage
$107,044
Outstanding Balance
$80,291
Interest Rate
4.3%
Mortgage Type
FHA
Estimated Equity
$91,177
Purchase Details
Closed on
Nov 21, 2002
Sold by
Brooks Wilma J
Bought by
Mitchell Lance E
Home Financials for this Owner
Home Financials are based on the most recent Mortgage that was taken out on this home.
Original Mortgage
$68,000
Interest Rate
6.08%
Mortgage Type
New Conventional
Purchase Details
Closed on
Jul 2, 2002
Sold by
Oldiges Matthew C
Bought by
Brooks Wilma J
Purchase Details
Closed on
Feb 1, 1999
Sold by
Joel L Clemons Pr Shrf
Bought by
Federal National Mortgage Association
Create a Home Valuation Report for This Property
The Home Valuation Report is an in-depth analysis detailing your home's value as well as a comparison with similar homes in the area
Home Values in the Area
Average Home Value in this Area
Purchase History
| Date | Buyer | Sale Price | Title Company |
|---|---|---|---|
| Thurber Darryl E | -- | None Available | |
| Mitchell Lance E | $85,000 | -- | |
| Brooks Wilma J | $86,900 | -- | |
| Federal National Mortgage Association | $50,000 | -- |
Source: Public Records
Mortgage History
| Date | Status | Borrower | Loan Amount |
|---|---|---|---|
| Open | Thurber Darryl E | $107,044 | |
| Closed | Mitchell Lance E | $68,000 |
Source: Public Records
Tax History Compared to Growth
Tax History
| Year | Tax Paid | Tax Assessment Tax Assessment Total Assessment is a certain percentage of the fair market value that is determined by local assessors to be the total taxable value of land and additions on the property. | Land | Improvement |
|---|---|---|---|---|
| 2024 | $1,382 | $39,570 | $4,640 | $34,930 |
| 2023 | $1,382 | $39,570 | $4,640 | $34,930 |
| 2022 | $1,224 | $30,740 | $3,770 | $26,970 |
| 2021 | $1,237 | $30,740 | $3,770 | $26,970 |
| 2020 | $1,237 | $30,740 | $3,770 | $26,970 |
| 2019 | $1,128 | $28,160 | $3,190 | $24,970 |
| 2018 | $1,112 | $28,160 | $3,190 | $24,970 |
| 2017 | $1,107 | $28,160 | $3,190 | $24,970 |
| 2016 | $966 | $24,550 | $3,190 | $21,360 |
| 2015 | $963 | $24,390 | $3,190 | $21,200 |
| 2014 | $963 | $24,390 | $3,190 | $21,200 |
| 2013 | $960 | $22,470 | $3,190 | $19,280 |
Source: Public Records
Map
Nearby Homes
- 209 Pike St
- 624 Saint Marys Ave
- 326 - 328 Maple St
- 326 Park St
- 206 E Ln
- 315 Washington St
- 301 N Miami Ave
- 107 N Ohio Ave Unit C
- 416 Elm St
- 105 N Ohio Ave Unit C
- 529 Linden Ave
- 512 Sycamore Ave
- 104 S Pomeroy Ave
- 709 Michigan St
- 413 E Poplar St
- 729 Michigan St
- 414 & 416 E Court St
- 410 Summit St
- 115 Brooklyn Ave
- 631 N Wagner Ave