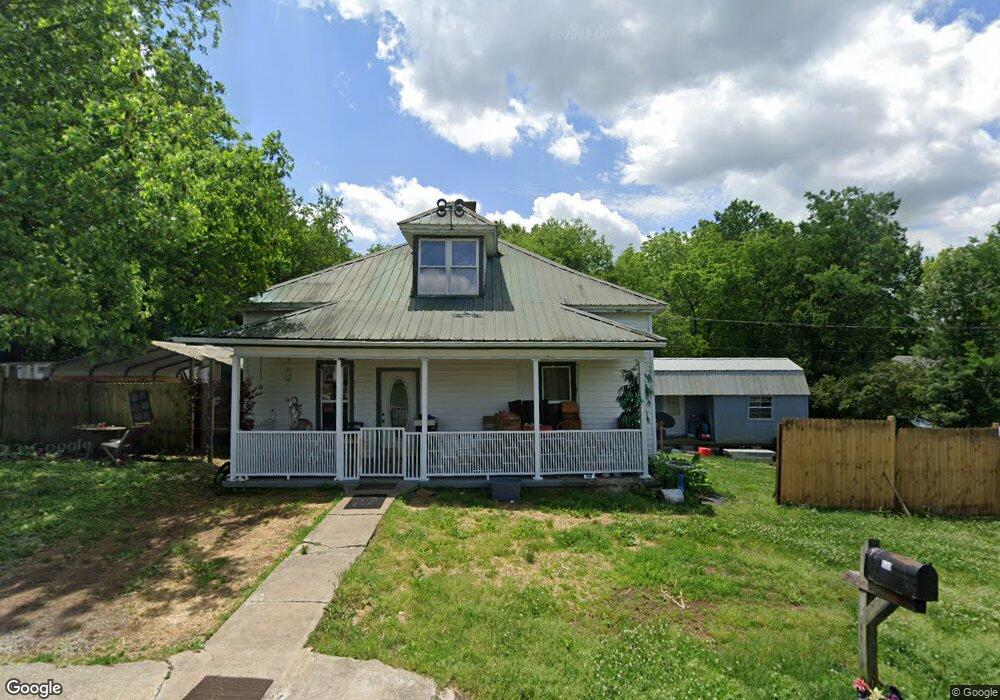
530 Oak St Shelbyville, TN 37160
Estimated Value: $117,586 - $230,000
3
Beds
1
Bath
1,540
Sq Ft
$117/Sq Ft
Est. Value
About This Home
This home is located at 530 Oak St, Shelbyville, TN 37160 and is currently estimated at $179,897, approximately $116 per square foot. 530 Oak St is a home located in Bedford County with nearby schools including East Side Elementary School, Harris Middle School, and Christian Chapel Academy.
Ownership History
Date
Name
Owned For
Owner Type
Purchase Details
Closed on
Mar 20, 2023
Sold by
Gunn Chuck
Bought by
Lasne Charles
Current Estimated Value
Purchase Details
Closed on
Jul 12, 2015
Sold by
Kachatorian Ray Trustee
Bought by
Gunn Chuck
Purchase Details
Closed on
Jun 19, 2001
Bought by
Kachtorian Al
Home Financials for this Owner
Home Financials are based on the most recent Mortgage that was taken out on this home.
Original Mortgage
$15,000
Interest Rate
7.17%
Purchase Details
Closed on
Feb 16, 2000
Sold by
Locker Jackie Arlene
Bought by
Vandygriff Bobby and Vandygriff Ann
Purchase Details
Closed on
Apr 1, 1998
Sold by
Bell Clarice P
Bought by
Locker Jackie A
Home Financials for this Owner
Home Financials are based on the most recent Mortgage that was taken out on this home.
Original Mortgage
$16,409
Interest Rate
7.14%
Purchase Details
Closed on
Aug 9, 1949
Bought by
Bell Clarice P and Bell Annie P
Create a Home Valuation Report for This Property
The Home Valuation Report is an in-depth analysis detailing your home's value as well as a comparison with similar homes in the area
Home Values in the Area
Average Home Value in this Area
Purchase History
| Date | Buyer | Sale Price | Title Company |
|---|---|---|---|
| Lasne Charles | $26,000 | -- | |
| Gunn Chuck | $32,000 | -- | |
| Kachtorian Al | $21,000 | -- | |
| Vandygriff Bobby | $11,500 | -- | |
| Locker Jackie A | $16,000 | -- | |
| Bell Clarice P | -- | -- |
Source: Public Records
Mortgage History
| Date | Status | Borrower | Loan Amount |
|---|---|---|---|
| Previous Owner | Bell Clarice P | $15,000 | |
| Previous Owner | Bell Clarice P | $16,409 |
Source: Public Records
Tax History Compared to Growth
Tax History
| Year | Tax Paid | Tax Assessment Tax Assessment Total Assessment is a certain percentage of the fair market value that is determined by local assessors to be the total taxable value of land and additions on the property. | Land | Improvement |
|---|---|---|---|---|
| 2025 | -- | $24,175 | $0 | $0 |
| 2024 | -- | $24,050 | $7,050 | $17,000 |
| 2023 | $915 | $24,050 | $7,050 | $17,000 |
| 2022 | $941 | $24,050 | $7,050 | $17,000 |
| 2021 | $855 | $24,050 | $7,050 | $17,000 |
| 2020 | $441 | $24,050 | $7,050 | $17,000 |
| 2019 | $441 | $9,950 | $3,750 | $6,200 |
| 2018 | $431 | $9,950 | $3,750 | $6,200 |
| 2017 | $431 | $9,950 | $3,750 | $6,200 |
| 2016 | $427 | $9,950 | $3,750 | $6,200 |
| 2015 | $427 | $9,950 | $3,750 | $6,200 |
| 2014 | $396 | $10,103 | $0 | $0 |
Source: Public Records
Map
Nearby Homes
- 709 Belmont Ave
- 120 Dogwood Ct
- 220 Walnut St
- 102 Germantown Rd
- 222 Carter St
- 211 S Fairoak St
- 0 E Depot St
- 215 Coney Island Rd
- 112 Elizabeth St
- 207 Martha St
- 314 Maplewood Dr
- 464 Whitthorne St
- 627 E Lane St
- 631 E Lane St
- 107 Rockwood Dr
- 527 Deery St
- 418 Riverview Dr
- 611 Coble Cir
- 713 King Ave
- 714 King Ave