A
Landlord's Agent in 2016
Artrese Payne
Beacon Property Mgmt & Realty

Estimated Value: $187,000 - $279,000
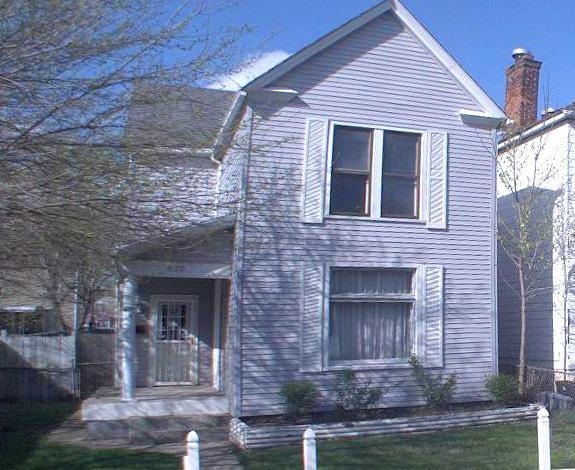
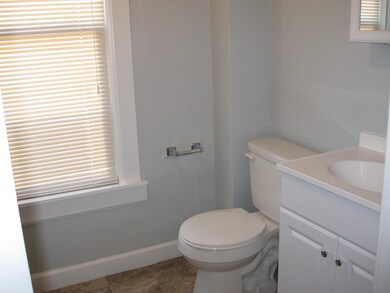
This home is located at 530 Siebert St, Columbus, OH 43206 since 14 June 2016 and is currently priced at $230,609. This property was built in 1908. 530 Siebert St is a home located in Franklin County with nearby schools including Lincoln Park Elementary School, South High School, and South Columbus Preparatory Academy.
Last Agent to Rent the Property
Artrese Payne
Beacon Property Mgmt & Realty Listed on: 06/14/2016
Last Renter's Agent
Artrese Payne
Beacon Property Mgmt & Realty Listed on: 06/14/2016
| Date | Buyer | Sale Price | Title Company |
|---|---|---|---|
| Patriarch Holdings Llc | $210,000 | Chase Title & Escrow Services | |
| Patriarch Real Estate Fund Llc | $172,500 | Mepapex Title | |
| Albatross Portfolio Holdings Llc | $154,000 | None Available | |
| 17Th District Realty Llc | $23,500 | Land & Mo | |
| Burke Crystal L | -- | Attorney | |
| Burke Crystal L | -- | None Available | |
| James Burke | $12,000 | -- | |
| -- | $35,000 | -- |
| Date | Status | Borrower | Loan Amount |
|---|---|---|---|
| Previous Owner | 17Th District Realty Llc | $547,200 |
| Date | Event | Price | List to Sale | Price per Sq Ft |
|---|---|---|---|---|
| 03/27/2025 03/27/25 | Off Market | $850 | -- | -- |
| 07/01/2016 07/01/16 | Rented | $850 | 0.0% | -- |
| 06/14/2016 06/14/16 | Rented | $850 | 0.0% | -- |
| 06/14/2016 06/14/16 | For Rent | $850 | -- | -- |
| Year | Tax Paid | Tax Assessment Tax Assessment Total Assessment is a certain percentage of the fair market value that is determined by local assessors to be the total taxable value of land and additions on the property. | Land | Improvement |
|---|---|---|---|---|
| 2025 | $3,243 | $70,770 | $21,630 | $49,140 |
| 2024 | $3,243 | $70,770 | $21,630 | $49,140 |
| 2023 | $3,227 | $70,770 | $21,630 | $49,140 |
| 2022 | $1,314 | $24,720 | $5,220 | $19,500 |
| 2021 | $1,316 | $24,720 | $5,220 | $19,500 |
| 2020 | $1,318 | $24,720 | $5,220 | $19,500 |
| 2019 | $1,117 | $17,960 | $4,030 | $13,930 |
| 2018 | $837 | $17,960 | $4,030 | $13,930 |
| 2017 | $1,331 | $17,960 | $4,030 | $13,930 |
| 2016 | $585 | $8,610 | $3,710 | $4,900 |
| 2015 | $533 | $8,610 | $3,710 | $4,900 |
| 2014 | $534 | $8,610 | $3,710 | $4,900 |
| 2013 | $440 | $14,385 | $3,920 | $10,465 |
A
Landlord's Agent in 2016
Artrese Payne
Beacon Property Mgmt & Realty
Source: Columbus and Central Ohio Regional MLS
MLS Number: 216021245
APN: 010-047672
Disclaimer: Certain information contained herein is derived from information provided by parties other than Homes.com. All information provided is deemed reliable, but is not guaranteed to be accurate and should be independently verified.
![]() IDX information is provided exclusively for personal, non-commercial use, and may not be used for any purpose other than to identify prospective properties consumers may be interested in purchasing.
IDX information is provided exclusively for personal, non-commercial use, and may not be used for any purpose other than to identify prospective properties consumers may be interested in purchasing.
Information is deemed reliable but not guaranteed.
Ask me questions while you tour the home.