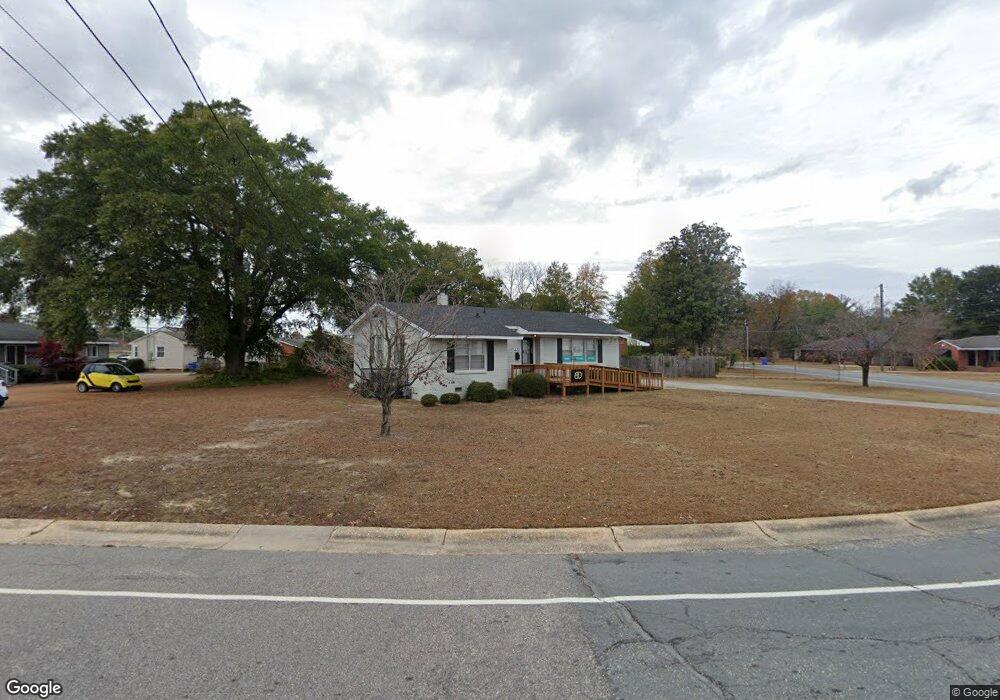
530 Terry Cir Fayetteville, NC 28304
Terry Sanford NeighborhoodEstimated Value: $180,000
3
Beds
2
Baths
1,297
Sq Ft
$139/Sq Ft
Est. Value
About This Home
This home is located at 530 Terry Cir, Fayetteville, NC 28304 and is currently priced at $180,000, approximately $138 per square foot. 530 Terry Cir is a home located in Cumberland County with nearby schools including Glendale Acres Elementary, Ashley Elementary, and R. Max Abbott Middle School.
Ownership History
Date
Name
Owned For
Owner Type
Purchase Details
Closed on
Nov 1, 2023
Sold by
Mckeithan Alabaster Diane
Bought by
Banks Alabaster David
Current Estimated Value
Purchase Details
Closed on
Feb 28, 2018
Sold by
David B Alabaster
Bought by
Whittington Alfonzo
Home Financials for this Owner
Home Financials are based on the most recent Mortgage that was taken out on this home.
Original Mortgage
$59,200
Interest Rate
4.4%
Create a Home Valuation Report for This Property
The Home Valuation Report is an in-depth analysis detailing your home's value as well as a comparison with similar homes in the area
Home Values in the Area
Average Home Value in this Area
Purchase History
| Date | Buyer | Sale Price | Title Company |
|---|---|---|---|
| Banks Alabaster David | -- | None Listed On Document | |
| Whittington Alfonzo | -- | -- |
Source: Public Records
Mortgage History
| Date | Status | Borrower | Loan Amount |
|---|---|---|---|
| Previous Owner | Whittington Alfonzo | $59,200 | |
| Previous Owner | Whittington Alfonzo | -- |
Source: Public Records
Tax History Compared to Growth
Tax History
| Year | Tax Paid | Tax Assessment Tax Assessment Total Assessment is a certain percentage of the fair market value that is determined by local assessors to be the total taxable value of land and additions on the property. | Land | Improvement |
|---|---|---|---|---|
| 2024 | $2,739 | $193,606 | $122,924 | $70,682 |
| 2023 | $3,158 | $193,606 | $122,924 | $70,682 |
| 2022 | $2,867 | $193,606 | $122,924 | $70,682 |
| 2021 | $2,867 | $193,606 | $122,924 | $70,682 |
| 2019 | $2,832 | $193,606 | $122,924 | $70,682 |
| 2018 | $2,832 | $193,606 | $122,924 | $70,682 |
| 2017 | $2,729 | $193,606 | $122,924 | $70,682 |
| 2016 | $2,251 | $170,565 | $41,292 | $129,273 |
| 2015 | $2,228 | $170,565 | $41,292 | $129,273 |
| 2014 | $2,221 | $170,565 | $103,231 | $67,334 |
Source: Public Records
Map
Nearby Homes