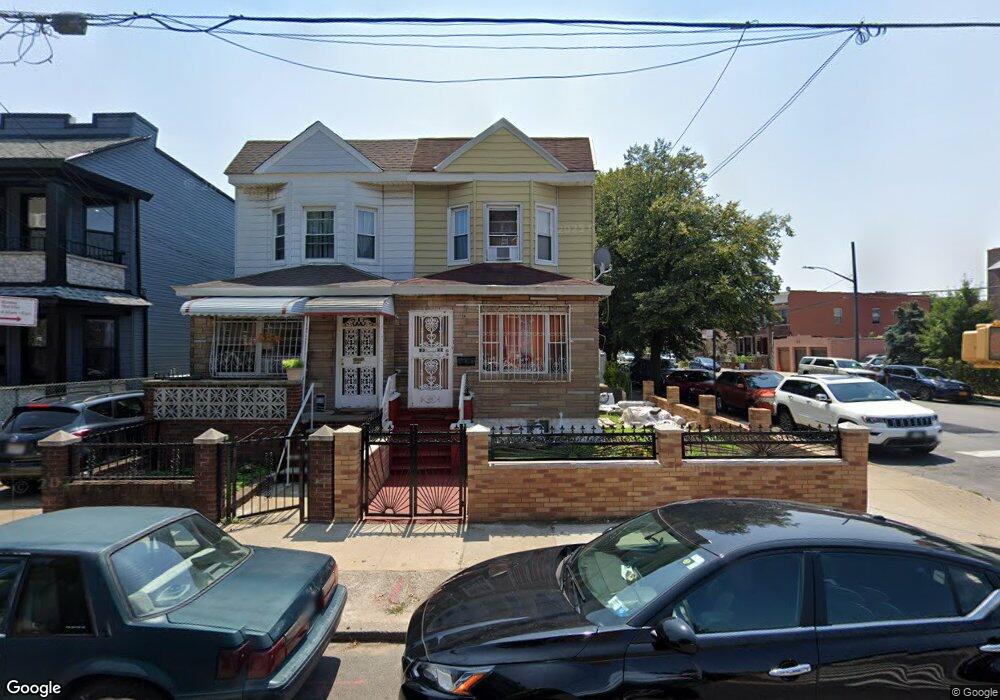
5302 Snyder Ave Brooklyn, NY 11203
East Flatbush NeighborhoodEstimated Value: $674,392 - $776,000
Studio
--
Bath
1,168
Sq Ft
$625/Sq Ft
Est. Value
About This Home
This home is located at 5302 Snyder Ave, Brooklyn, NY 11203 and is currently estimated at $730,098, approximately $625 per square foot. 5302 Snyder Ave is a home located in Kings County with nearby schools including Ps 244 Richard R Green, East Flatbush Community Research School, and Ivy Hill Preparatory Charter School.
Ownership History
Date
Name
Owned For
Owner Type
Purchase Details
Closed on
Sep 19, 2006
Sold by
White Ceon
Bought by
White Ann
Current Estimated Value
Purchase Details
Closed on
May 23, 2005
Sold by
White Ann and White Garfield
Bought by
White Ceon
Purchase Details
Closed on
Apr 27, 2001
Sold by
Best Express Homes Inc
Bought by
White Ann and White Garfield
Home Financials for this Owner
Home Financials are based on the most recent Mortgage that was taken out on this home.
Original Mortgage
$226,446
Outstanding Balance
$82,517
Interest Rate
7.03%
Estimated Equity
$647,581
Purchase Details
Closed on
Sep 7, 2000
Sold by
Headley Trevor
Bought by
Best Express Homes Inc
Purchase Details
Closed on
May 20, 1998
Sold by
Louis Michel G Pierre
Bought by
Exil Lucienne
Home Financials for this Owner
Home Financials are based on the most recent Mortgage that was taken out on this home.
Original Mortgage
$123,500
Interest Rate
6.62%
Create a Home Valuation Report for This Property
The Home Valuation Report is an in-depth analysis detailing your home's value as well as a comparison with similar homes in the area
Home Values in the Area
Average Home Value in this Area
Purchase History
| Date | Buyer | Sale Price | Title Company |
|---|---|---|---|
| White Ann | -- | -- | |
| White Ann | -- | -- | |
| White Ceon | -- | -- | |
| White Ceon | -- | -- | |
| White Ann | -- | -- | |
| White Ann | -- | -- | |
| Best Express Homes Inc | $120,000 | -- | |
| Best Express Homes Inc | $120,000 | -- | |
| Exil Lucienne | $130,000 | Stewart Title Insurance Co | |
| Exil Lucienne | $130,000 | Stewart Title Insurance Co |
Source: Public Records
Mortgage History
| Date | Status | Borrower | Loan Amount |
|---|---|---|---|
| Open | White Ann | $226,446 | |
| Closed | White Ann | $226,446 | |
| Previous Owner | Exil Lucienne | $123,500 | |
| Closed | White Ceon | $0 |
Source: Public Records
Tax History
| Year | Tax Paid | Tax Assessment Tax Assessment Total Assessment is a certain percentage of the fair market value that is determined by local assessors to be the total taxable value of land and additions on the property. | Land | Improvement |
|---|---|---|---|---|
| 2025 | $4,495 | $38,400 | $11,760 | $26,640 |
| 2024 | $4,495 | $34,740 | $11,760 | $22,980 |
| 2023 | $4,545 | $32,820 | $11,760 | $21,060 |
| 2022 | $4,433 | $35,940 | $11,760 | $24,180 |
| 2021 | $4,409 | $34,980 | $11,760 | $23,220 |
| 2020 | $2,068 | $26,280 | $11,760 | $14,520 |
| 2019 | $3,901 | $26,280 | $11,760 | $14,520 |
| 2018 | $3,801 | $18,648 | $7,505 | $11,143 |
| 2017 | $3,773 | $18,507 | $9,571 | $8,936 |
| 2016 | $3,490 | $17,460 | $8,148 | $9,312 |
| 2015 | $1,886 | $16,472 | $11,546 | $4,926 |
| 2014 | $1,886 | $15,540 | $13,080 | $2,460 |
Source: Public Records
Map
Nearby Homes
- 5304 Snyder Ave
- 5306 Snyder Ave
- 5310 Snyder Ave
- 401 E 53rd St
- 5312 Snyder Ave
- 394 E 53rd St
- 394 E 53 St
- 407-411 E 53rd St
- 404-406 E 53rd St
- 5214 Snyder Ave
- 5318 Snyder Ave
- 413 E 53rd St
- 5212 Snyder Ave
- 356 E 54th St
- 408 E 53rd St
- 415 E 53rd St
- 410 E 53rd St Unit 1st Fl
- 410 E 53rd St Unit 2nd Fl
- 410 E 53rd St
- 354 E 54th St Unit Building
Your Personal Tour Guide
Ask me questions while you tour the home.