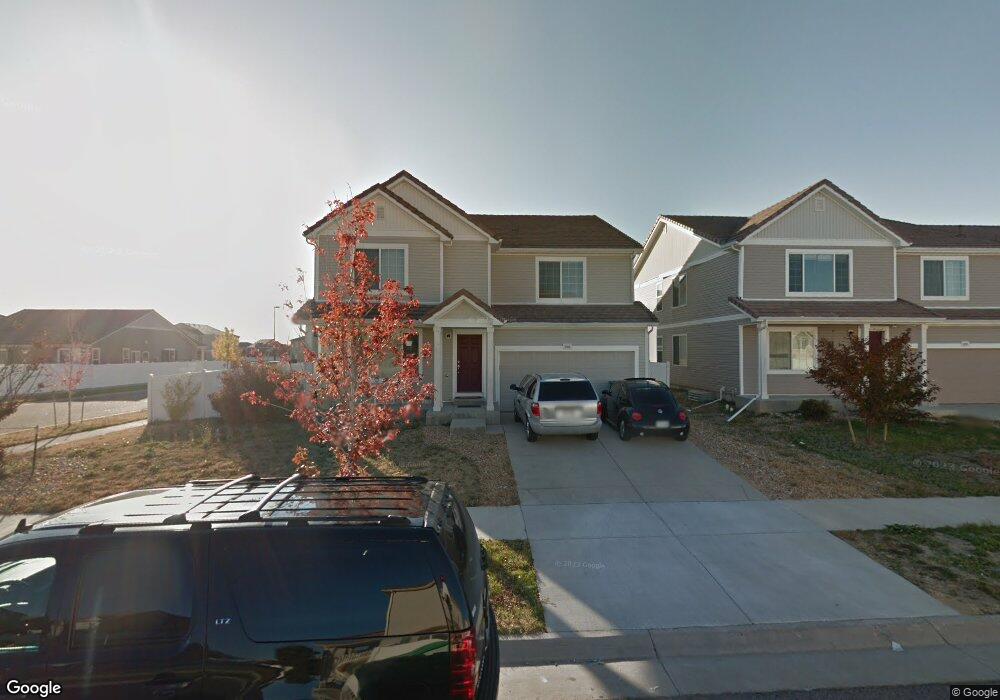
5303 Malaya St Denver, CO 80249
Green Valley Ranch NeighborhoodEstimated Value: $602,524 - $737,000
4
Beds
3
Baths
5,338
Sq Ft
$122/Sq Ft
Est. Value
About This Home
This home is located at 5303 Malaya St, Denver, CO 80249 and is currently estimated at $652,631, approximately $122 per square foot. 5303 Malaya St is a home located in Denver County with nearby schools including Pitt-Waller K-8 School, McGlone Academy, and Marie L. Greenwood Academy.
Ownership History
Date
Name
Owned For
Owner Type
Purchase Details
Closed on
Jun 14, 2012
Sold by
Us Bank National Association
Bought by
Walker Maurice J
Current Estimated Value
Home Financials for this Owner
Home Financials are based on the most recent Mortgage that was taken out on this home.
Original Mortgage
$228,000
Interest Rate
3.63%
Mortgage Type
New Conventional
Purchase Details
Closed on
Mar 12, 2012
Sold by
Harbi Abdelmoujoud and Elwarari Imane
Bought by
U S Bank National Association and Bank Of America Na
Purchase Details
Closed on
May 31, 2007
Sold by
Oakwood Homes Llc
Bought by
Harbi Abdel Moujoud and Elwarari Imane
Home Financials for this Owner
Home Financials are based on the most recent Mortgage that was taken out on this home.
Original Mortgage
$294,975
Interest Rate
8.35%
Mortgage Type
Balloon
Create a Home Valuation Report for This Property
The Home Valuation Report is an in-depth analysis detailing your home's value as well as a comparison with similar homes in the area
Home Values in the Area
Average Home Value in this Area
Purchase History
| Date | Buyer | Sale Price | Title Company |
|---|---|---|---|
| Walker Maurice J | $240,000 | North American Title | |
| U S Bank National Association | -- | None Available | |
| Us Bank National Association | -- | None Available | |
| Harbi Abdel Moujoud | $310,500 | Town & Country Title Service |
Source: Public Records
Mortgage History
| Date | Status | Borrower | Loan Amount |
|---|---|---|---|
| Previous Owner | Walker Maurice J | $228,000 | |
| Previous Owner | Harbi Abdel Moujoud | $294,975 |
Source: Public Records
Tax History Compared to Growth
Tax History
| Year | Tax Paid | Tax Assessment Tax Assessment Total Assessment is a certain percentage of the fair market value that is determined by local assessors to be the total taxable value of land and additions on the property. | Land | Improvement |
|---|---|---|---|---|
| 2024 | $5,283 | $41,290 | $2,750 | $38,540 |
| 2023 | $5,085 | $41,290 | $2,750 | $38,540 |
| 2022 | $4,446 | $33,400 | $5,790 | $27,610 |
| 2021 | $4,108 | $34,370 | $5,960 | $28,410 |
| 2020 | $4,166 | $31,440 | $5,960 | $25,480 |
| 2019 | $4,101 | $31,440 | $5,960 | $25,480 |
| 2018 | $3,611 | $26,670 | $3,690 | $22,980 |
| 2017 | $4,480 | $26,670 | $3,690 | $22,980 |
| 2016 | $4,322 | $26,110 | $3,566 | $22,544 |
| 2015 | $4,233 | $26,110 | $3,566 | $22,544 |
| 2014 | $3,027 | $19,150 | $2,388 | $16,762 |
Source: Public Records
Map
Nearby Homes
- 5293 Malaya St
- 20888 E 51st Place
- 5134 Malaya St
- 20553 E 50th Place
- 5535 Nepal St
- 5556 Liverpool St
- 5550 Malta St
- 21313 E 55th Ave
- 5012 Liverpool St
- 5567 Malta St
- 21476 E 53rd Place
- 21354 E 51st Ave
- 20384 E 53rd Dr
- 4984 Jericho St
- 20870 Beekman Place
- 20476 Robins Dr
- 5572 Killarney St
- 20858 E 49th Dr
- 5571 Killarney St
- 5120 Perth St
- 5323 Malaya St
- 5300 Liverpool St
- 5343 Malaya St
- 5320 Liverpool St
- 5340 Liverpool St
- 5363 Malaya St
- 21003 E 53rd Ave
- 5290 Liverpool St
- 5360 Liverpool St
- 21004 E 53rd Place
- 5283 Malaya St
- 5383 Malaya St
- 5294 Malaya St
- 5280 Liverpool St
- 5380 Liverpool St
- 5273 Malaya St
- 5309 Liverpool St
- 5329 Liverpool St
- 21034 E 53rd Place
- 5260 Liverpool St