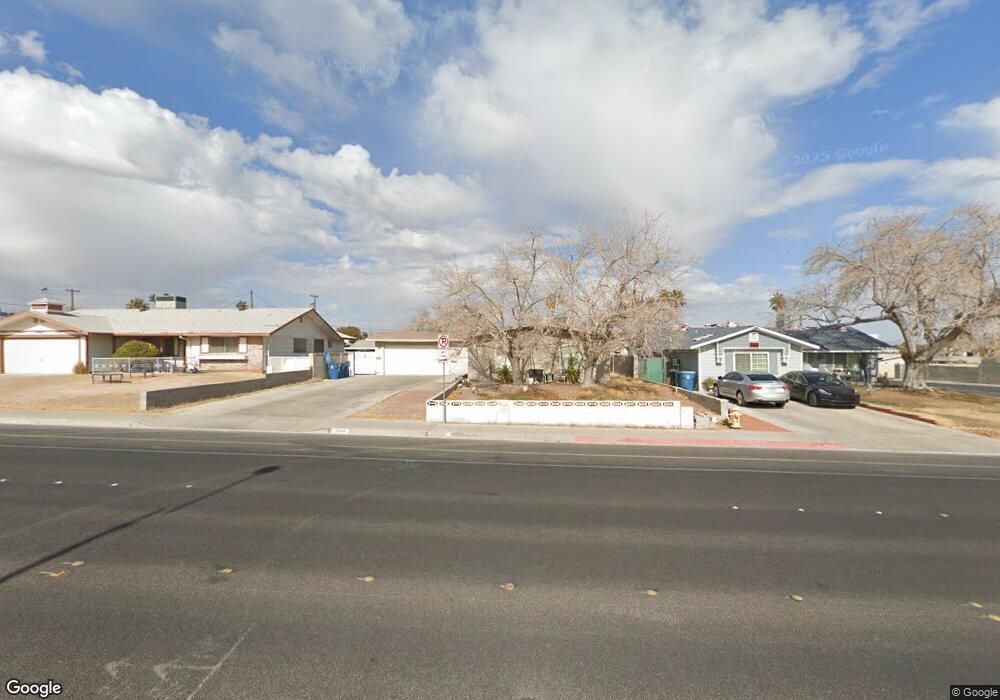
5304 W Oakey Blvd Las Vegas, NV 89146
Buffalo NeighborhoodEstimated Value: $351,000 - $437,000
3
Beds
2
Baths
1,354
Sq Ft
$279/Sq Ft
Est. Value
About This Home
This home is located at 5304 W Oakey Blvd, Las Vegas, NV 89146 and is currently estimated at $377,754, approximately $278 per square foot. 5304 W Oakey Blvd is a home located in Clark County with nearby schools including Doris Hancock Elementary School, Hyde Park Middle School, and Bonanza High School.
Ownership History
Date
Name
Owned For
Owner Type
Purchase Details
Closed on
Jun 10, 2014
Sold by
Gifford Nhu Y
Bought by
Gifford Nhu Y and Nhu Y Gifford Trust
Current Estimated Value
Purchase Details
Closed on
Jul 15, 2010
Sold by
International Property Holdings Llc
Bought by
Gifford Nhu Y
Home Financials for this Owner
Home Financials are based on the most recent Mortgage that was taken out on this home.
Original Mortgage
$93,279
Outstanding Balance
$64,353
Interest Rate
5.5%
Mortgage Type
FHA
Estimated Equity
$313,401
Purchase Details
Closed on
Oct 19, 2009
Sold by
Hukles Mario
Bought by
International Property Holdings Llc
Purchase Details
Closed on
Aug 1, 2005
Sold by
Hukles Cristina Alejandro
Bought by
Hukles Mario
Home Financials for this Owner
Home Financials are based on the most recent Mortgage that was taken out on this home.
Original Mortgage
$215,760
Interest Rate
5.28%
Mortgage Type
Negative Amortization
Purchase Details
Closed on
Jul 23, 2005
Sold by
Liv Lisa
Bought by
Hukles Mario
Home Financials for this Owner
Home Financials are based on the most recent Mortgage that was taken out on this home.
Original Mortgage
$215,760
Interest Rate
5.28%
Mortgage Type
Negative Amortization
Purchase Details
Closed on
Jun 4, 2004
Sold by
Liv John
Bought by
Liv Lisa
Home Financials for this Owner
Home Financials are based on the most recent Mortgage that was taken out on this home.
Original Mortgage
$152,000
Interest Rate
6.25%
Mortgage Type
Unknown
Purchase Details
Closed on
Apr 27, 2004
Sold by
Chiu Ying Yi
Bought by
Huang Qun Fang
Home Financials for this Owner
Home Financials are based on the most recent Mortgage that was taken out on this home.
Original Mortgage
$152,000
Interest Rate
6.25%
Mortgage Type
Unknown
Purchase Details
Closed on
Mar 24, 2004
Sold by
Spartan Management Group
Bought by
Huang Qun Fang
Home Financials for this Owner
Home Financials are based on the most recent Mortgage that was taken out on this home.
Original Mortgage
$148,500
Interest Rate
5.35%
Mortgage Type
Credit Line Revolving
Purchase Details
Closed on
Feb 18, 2004
Sold by
Gahr Judith A
Bought by
Spartan Management Group
Home Financials for this Owner
Home Financials are based on the most recent Mortgage that was taken out on this home.
Original Mortgage
$148,500
Interest Rate
5.35%
Mortgage Type
Credit Line Revolving
Create a Home Valuation Report for This Property
The Home Valuation Report is an in-depth analysis detailing your home's value as well as a comparison with similar homes in the area
Home Values in the Area
Average Home Value in this Area
Purchase History
| Date | Buyer | Sale Price | Title Company |
|---|---|---|---|
| Gifford Nhu Y | -- | None Available | |
| Gifford Nhu Y | $95,000 | Ticor Title Of Nevada Inc | |
| International Property Holdings Llc | $50,401 | None Available | |
| Hukles Mario | -- | Chicago Title | |
| Hukles Mario | $250,000 | Chicago Title | |
| Liv Lisa | -- | Old Republic Title Co Of Ne | |
| Liv Lisa | $190,000 | Old Republic Title Co Of Ne | |
| Huang Qun Fang | -- | First American Title Co Of | |
| Huang Qun Fang | $165,000 | First American Title Co Of | |
| Spartan Management Group | $29,980 | -- |
Source: Public Records
Mortgage History
| Date | Status | Borrower | Loan Amount |
|---|---|---|---|
| Open | Gifford Nhu Y | $93,279 | |
| Previous Owner | Hukles Mario | $215,760 | |
| Previous Owner | Liv Lisa | $152,000 | |
| Previous Owner | Huang Qun Fang | $148,500 |
Source: Public Records
Tax History Compared to Growth
Tax History
| Year | Tax Paid | Tax Assessment Tax Assessment Total Assessment is a certain percentage of the fair market value that is determined by local assessors to be the total taxable value of land and additions on the property. | Land | Improvement |
|---|---|---|---|---|
| 2025 | $959 | $54,156 | $33,250 | $20,906 |
| 2024 | $931 | $54,156 | $33,250 | $20,906 |
| 2023 | $931 | $51,718 | $32,900 | $18,818 |
| 2022 | $904 | $45,192 | $28,350 | $16,842 |
| 2021 | $878 | $40,878 | $25,200 | $15,678 |
| 2020 | $849 | $38,314 | $23,100 | $15,214 |
| 2019 | $839 | $33,965 | $19,250 | $14,715 |
| 2018 | $801 | $31,656 | $17,850 | $13,806 |
| 2017 | $942 | $28,734 | $15,050 | $13,684 |
| 2016 | $751 | $25,305 | $10,500 | $14,805 |
| 2015 | $748 | $22,135 | $7,000 | $15,135 |
| 2014 | $726 | $22,355 | $7,000 | $15,355 |
Source: Public Records
Map
Nearby Homes
- 5301 Westleigh Ave
- 5321 Westleigh Ave
- 1800 Edmond St Unit 229
- 1800 Edmond St Unit 227
- 1800 Edmond St Unit 218
- 1800 Edmond St Unit 210
- 5324 Del Monte Ave
- 5209 Del Monte Ave
- 22 Mountain View Dr
- 30 Mountain View Dr
- 5304 Mountain View Dr
- 5305 Del Rey Ave
- 5290 Obannon Dr
- 5333 Longridge Ave
- 1440 Covelo Ct
- 5132 Del Rey Ave
- 1780 Westwind Rd
- 5600 El Parque Ave
- 2065 Lindell Rd
- 1970 Westwind Rd
- 5308 W Oakey Blvd
- 5300 W Oakey Blvd
- 5305 Westleigh Ave
- 5309 Westleigh Ave
- 5313 Westleigh Ave
- 5316 W Oakey Blvd
- 5236 W Oakey Blvd
- 5317 Westleigh Ave
- 5237 Westleigh Ave
- 5320 W Oakey Blvd
- 5232 W Oakey Blvd
- 5233 Westleigh Ave
- 5304 Westleigh Ave
- 5308 Westleigh Ave
- 5300 Westleigh Ave
- 5301 W Oakey Blvd
- 5228 W Oakey Blvd
- 5312 Westleigh Ave
- 5301 W Oakey Bl Blvd