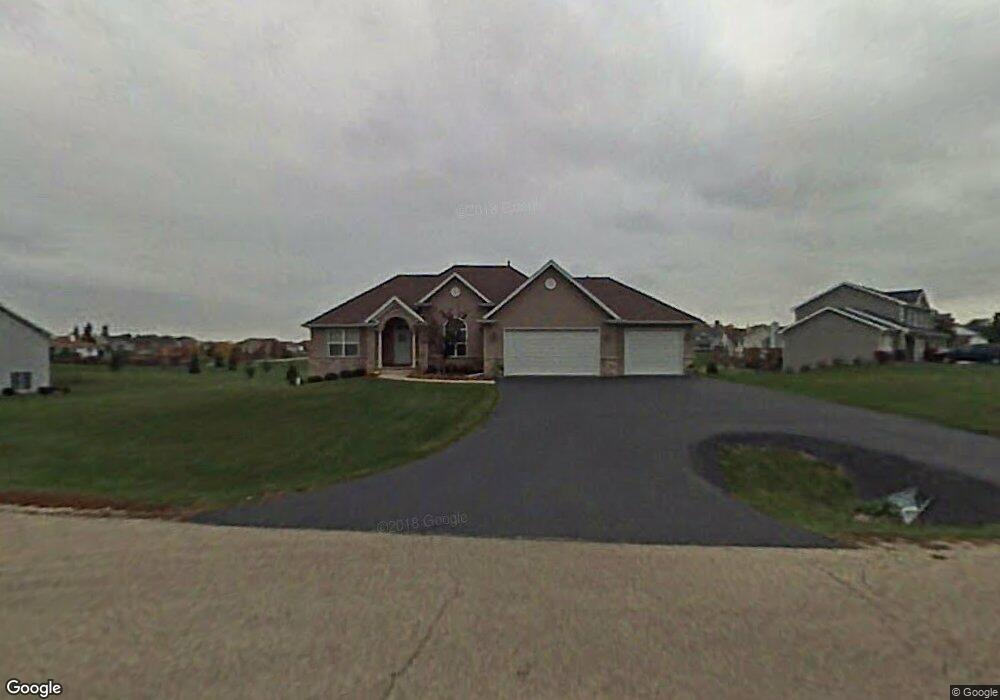
5305 Joseph Cir Johnsburg, IL 60051
Pistakee Highlands NeighborhoodEstimated Value: $438,000 - $532,000
3
Beds
3
Baths
1,959
Sq Ft
$248/Sq Ft
Est. Value
About This Home
This home is located at 5305 Joseph Cir, Johnsburg, IL 60051 and is currently estimated at $486,465, approximately $248 per square foot. 5305 Joseph Cir is a home located in McHenry County with nearby schools including Ringwood School Primary Center, Johnsburg Elementary School, and Johnsburg Jr High School.
Ownership History
Date
Name
Owned For
Owner Type
Purchase Details
Closed on
May 9, 2007
Sold by
Hinchey Shaun M and Hinchey Jennifer L
Bought by
Massier Horst W and Massier Diane C
Current Estimated Value
Home Financials for this Owner
Home Financials are based on the most recent Mortgage that was taken out on this home.
Original Mortgage
$211,000
Outstanding Balance
$128,555
Interest Rate
6.2%
Mortgage Type
Unknown
Estimated Equity
$357,910
Purchase Details
Closed on
Jan 12, 2004
Sold by
Thurman Brad
Bought by
Hinchey Shaun M and Hinchey Jennifer L
Home Financials for this Owner
Home Financials are based on the most recent Mortgage that was taken out on this home.
Original Mortgage
$279,350
Interest Rate
4.62%
Mortgage Type
Unknown
Purchase Details
Closed on
Jun 30, 2003
Sold by
Lasalle Bank Na
Bought by
Thurman Brad
Home Financials for this Owner
Home Financials are based on the most recent Mortgage that was taken out on this home.
Original Mortgage
$48,480
Interest Rate
5.5%
Mortgage Type
Unknown
Create a Home Valuation Report for This Property
The Home Valuation Report is an in-depth analysis detailing your home's value as well as a comparison with similar homes in the area
Home Values in the Area
Average Home Value in this Area
Purchase History
| Date | Buyer | Sale Price | Title Company |
|---|---|---|---|
| Massier Horst W | $383,000 | Chicago Title Insurance Co | |
| Hinchey Shaun M | $294,095 | Multiple | |
| Thurman Brad | $59,900 | Fatic |
Source: Public Records
Mortgage History
| Date | Status | Borrower | Loan Amount |
|---|---|---|---|
| Open | Massier Horst W | $211,000 | |
| Previous Owner | Hinchey Shaun M | $279,350 | |
| Previous Owner | Thurman Brad | $48,480 |
Source: Public Records
Tax History
| Year | Tax Paid | Tax Assessment Tax Assessment Total Assessment is a certain percentage of the fair market value that is determined by local assessors to be the total taxable value of land and additions on the property. | Land | Improvement |
|---|---|---|---|---|
| 2024 | $9,391 | $141,602 | $24,082 | $117,520 |
| 2023 | $9,196 | $126,861 | $21,575 | $105,286 |
| 2022 | $8,893 | $117,693 | $20,016 | $97,677 |
| 2021 | $8,487 | $109,604 | $18,640 | $90,964 |
| 2020 | $8,234 | $105,035 | $17,863 | $87,172 |
| 2019 | $8,113 | $99,739 | $16,962 | $82,777 |
| 2018 | $6,603 | $80,786 | $16,193 | $64,593 |
| 2017 | $6,424 | $75,820 | $15,198 | $60,622 |
| 2016 | $6,349 | $70,860 | $14,204 | $56,656 |
| 2013 | -- | $69,764 | $13,984 | $55,780 |
Source: Public Records
Map
Nearby Homes
- 5302 Autumn Way
- 5103 Autumn Way
- 1001 W Broadway St
- 615 W Eastern Ave
- Lot 11 Blk 4 Acorn Ln
- 5205 N Lake St
- 5207 N Lake St
- 5010 Woodrow Ave
- 706 Henry Trail
- 5615 Bunny Ave
- 5716 Bunny Ave
- 4802 Brorson Ln
- 5504 Louella Ave
- 1512 W Oakleaf Dr
- 1319 Nippersink Dr
- 609 Monterrey Terrace
- 625 Monterrey Terrace
- 4415 Mayfair Dr
- 1322 Lakeview St
- 912 River Terrace Dr
- 5313 Joseph Cir
- 1102 Joseph Cir
- 1101 Joseph Cir
- 5304 Joseph Cir
- 1110 Joseph Cir
- 5317 Joseph Cir
- 5218 Beacon Hill Dr
- 5308 Joseph Cir
- 1107 Joseph Cir
- 5319 Joseph Cir
- 5207 N Beacon Hill Dr
- 5312 Joseph Cir
- 1113 Joseph Cir
- 5316 Joseph Cir
- 5308 Autumn Way
- 5203 N Beacon Hill Dr
- 5320 Joseph Cir
- 1019 W Windsor Dr
- 1015 W Windsor Dr
- 5314 Autumn Way
Your Personal Tour Guide
Ask me questions while you tour the home.