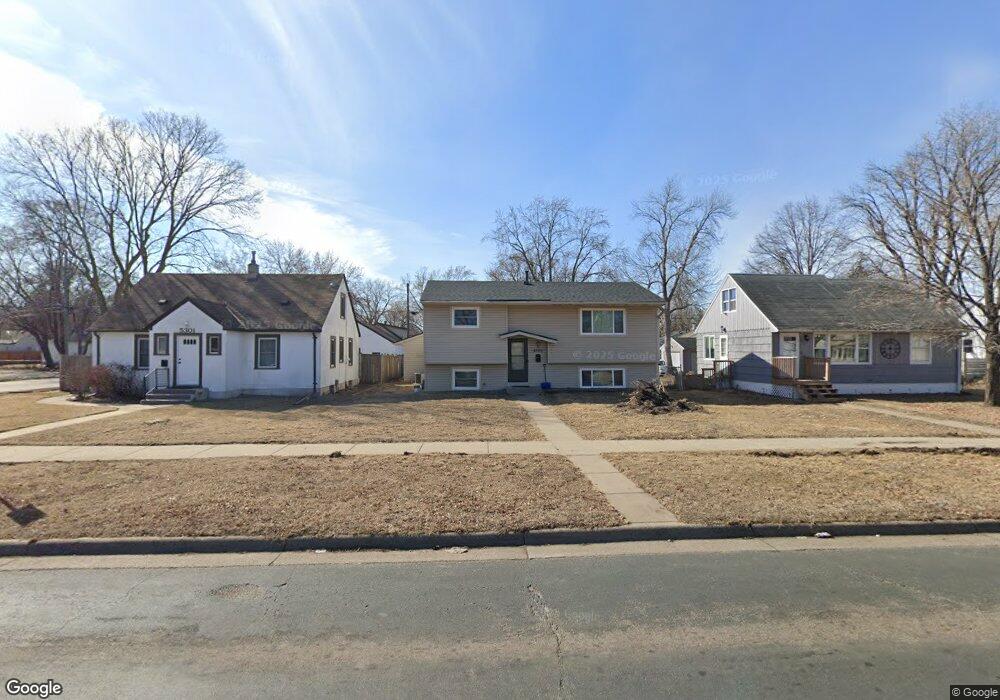
5305 Logan Ave N Minneapolis, MN 55430
Lions NeighborhoodEstimated Value: $276,000 - $299,008
3
Beds
2
Baths
955
Sq Ft
$305/Sq Ft
Est. Value
About This Home
This home is located at 5305 Logan Ave N, Minneapolis, MN 55430 and is currently estimated at $291,252, approximately $304 per square foot. 5305 Logan Ave N is a home located in Hennepin County with nearby schools including Brooklyn Center Elementary STEAM, Progeny Academy, and Bright Water MontessoriSchool.
Ownership History
Date
Name
Owned For
Owner Type
Purchase Details
Closed on
Sep 1, 2016
Sold by
Whitmore Kiah Angelica and Whitmore Rashad
Bought by
Bakayoko Daouda
Current Estimated Value
Home Financials for this Owner
Home Financials are based on the most recent Mortgage that was taken out on this home.
Original Mortgage
$159,065
Outstanding Balance
$126,315
Interest Rate
3.25%
Mortgage Type
FHA
Estimated Equity
$164,937
Purchase Details
Closed on
Oct 30, 2009
Sold by
Certified Mortgage Investors Co
Bought by
Smith Kiawangelica
Purchase Details
Closed on
Dec 5, 2003
Sold by
Buffington Jeffrey D and Buffington Lisa L
Bought by
Rimpson Lavern L and Rimpson Kimberly A
Purchase Details
Closed on
Jun 4, 1996
Sold by
Miller Paul W
Bought by
Buffington Jeffrey D and Buffington Lisa L
Create a Home Valuation Report for This Property
The Home Valuation Report is an in-depth analysis detailing your home's value as well as a comparison with similar homes in the area
Home Values in the Area
Average Home Value in this Area
Purchase History
| Date | Buyer | Sale Price | Title Company |
|---|---|---|---|
| Bakayoko Daouda | $162,000 | Liberty Title Inc | |
| Smith Kiawangelica | $122,000 | -- | |
| Rimpson Lavern L | $180,000 | -- | |
| Buffington Jeffrey D | $78,000 | -- |
Source: Public Records
Mortgage History
| Date | Status | Borrower | Loan Amount |
|---|---|---|---|
| Open | Bakayoko Daouda | $159,065 |
Source: Public Records
Tax History Compared to Growth
Tax History
| Year | Tax Paid | Tax Assessment Tax Assessment Total Assessment is a certain percentage of the fair market value that is determined by local assessors to be the total taxable value of land and additions on the property. | Land | Improvement |
|---|---|---|---|---|
| 2024 | $4,483 | $292,200 | $66,000 | $226,200 |
| 2023 | $4,244 | $281,900 | $54,000 | $227,900 |
| 2022 | $3,547 | $295,000 | $76,000 | $219,000 |
| 2021 | $3,825 | $244,000 | $63,000 | $181,000 |
| 2020 | $3,558 | $230,000 | $56,000 | $174,000 |
| 2019 | $2,812 | $214,000 | $50,000 | $164,000 |
| 2018 | $2,521 | $169,000 | $46,000 | $123,000 |
| 2017 | $1,949 | $133,000 | $33,000 | $100,000 |
| 2016 | $2,219 | $135,500 | $38,000 | $97,500 |
| 2015 | $2,338 | $144,600 | $34,100 | $110,500 |
| 2014 | -- | $117,300 | $32,600 | $84,700 |
Source: Public Records
Map
Nearby Homes
- 5307 Newton Ave N
- 5146 Newton Ave N
- 5252 Queen Ave N
- 5253 Queen Ave N
- 5239 Humboldt Ave N
- 5135 Irving Ave N
- 5118 James Ave N
- 5136 Queen Ave N
- 5557 Logan Ave N
- 5344 Girard Ave N
- 5122 Sheridan Ave N
- 5524 Humboldt Ave N
- 5030 Russell Ave N
- 4918 Morgan Ave N
- 5101 Fremont Ave N
- 4914 Oliver Ave N
- 4921 Penn Ave N
- 5527 Fremont Ave N
- 5244 Vincent Ave N
- 5104 Vincent Ave N
- 5311 Logan Ave N
- 5301 Logan Ave N
- 5315 Logan Ave N
- 5306 Morgan Ave N
- 5317 Logan Ave N
- 5312 Morgan Ave N
- 5318 Morgan Ave N
- 5257 Logan Ave N
- 5310 Logan Ave N
- 5316 Logan Ave N
- 5300 Logan Ave N
- 5319 Logan Ave N
- 5322 Logan Ave N
- 5322 Morgan Ave N
- 5256 Morgan Ave N
- 5328 Logan Ave N
- 5251 Logan Ave N
- 5328 Morgan Ave N
- 5323 Logan Ave N
- 5254 Logan Ave N