Estimated Value: $330,372 - $372,000
3
Beds
2
Baths
2,240
Sq Ft
$153/Sq Ft
Est. Value
About This Home
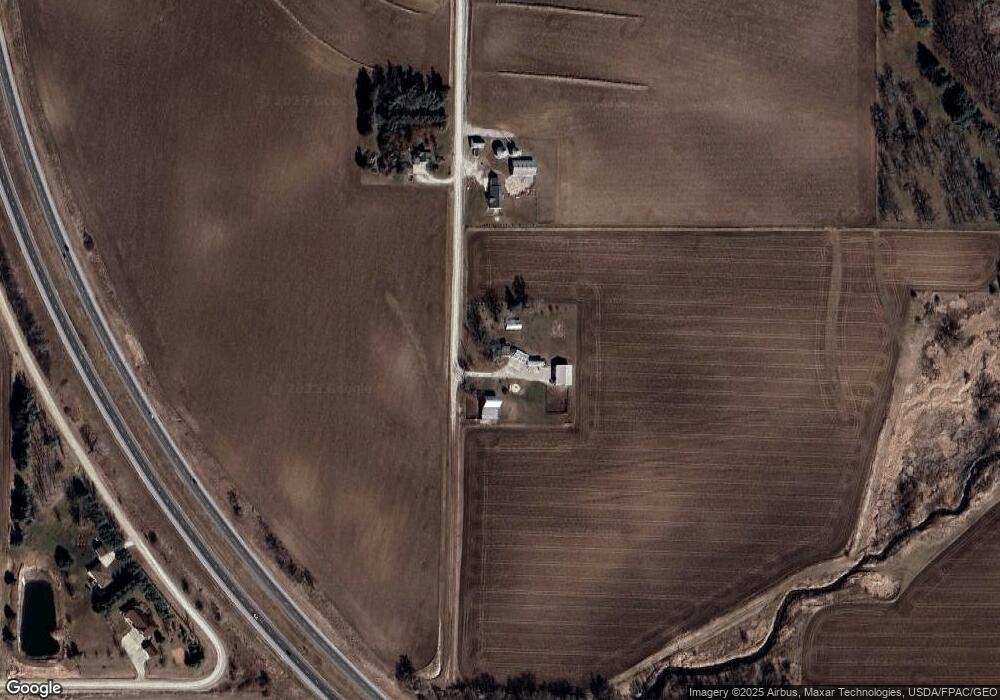
This home is located at 5305 McStay Rd, Jesup, IA 50648 and is currently estimated at $343,093, approximately $153 per square foot. 5305 McStay Rd is a home located in Black Hawk County with nearby schools including Jesup Elementary School, Jesup Middle School, and Jesup High School.
Ownership History
Date
Name
Owned For
Owner Type
Purchase Details
Closed on
Jul 29, 2011
Sold by
Delagardelle Matthew J and Delagardelle Heather
Bought by
Pint David M and Pint Cindy J
Current Estimated Value
Home Financials for this Owner
Home Financials are based on the most recent Mortgage that was taken out on this home.
Original Mortgage
$160,650
Outstanding Balance
$111,024
Interest Rate
4.53%
Mortgage Type
Purchase Money Mortgage
Estimated Equity
$232,069
Purchase Details
Closed on
Sep 26, 2008
Sold by
Weber Dale J
Bought by
Delagardelle Matthew J
Home Financials for this Owner
Home Financials are based on the most recent Mortgage that was taken out on this home.
Original Mortgage
$140,000
Interest Rate
6.43%
Mortgage Type
Purchase Money Mortgage
Purchase Details
Closed on
Nov 16, 2007
Sold by
Youngblut Kenneth J and Youngblut Beverly A
Bought by
Weber Dale J
Home Financials for this Owner
Home Financials are based on the most recent Mortgage that was taken out on this home.
Original Mortgage
$135,000
Interest Rate
6.47%
Mortgage Type
New Conventional
Create a Home Valuation Report for This Property
The Home Valuation Report is an in-depth analysis detailing your home's value as well as a comparison with similar homes in the area
Home Values in the Area
Average Home Value in this Area
Purchase History
| Date | Buyer | Sale Price | Title Company |
|---|---|---|---|
| Pint David M | $178,500 | Title Services Corporation | |
| Delagardelle Matthew J | $175,000 | Black Hawk County Abstract & | |
| Weber Dale J | $180,000 | Black Hawk County Abstract & |
Source: Public Records
Mortgage History
| Date | Status | Borrower | Loan Amount |
|---|---|---|---|
| Open | Pint David M | $160,650 | |
| Previous Owner | Delagardelle Matthew J | $140,000 | |
| Previous Owner | Weber Dale J | $135,000 |
Source: Public Records
Tax History Compared to Growth
Tax History
| Year | Tax Paid | Tax Assessment Tax Assessment Total Assessment is a certain percentage of the fair market value that is determined by local assessors to be the total taxable value of land and additions on the property. | Land | Improvement |
|---|---|---|---|---|
| 2024 | $3,138 | $261,060 | $69,000 | $192,060 |
| 2023 | $3,032 | $248,540 | $69,000 | $179,540 |
| 2022 | $2,966 | $222,230 | $57,500 | $164,730 |
| 2021 | $2,690 | $222,230 | $57,500 | $164,730 |
| 2020 | $2,702 | $193,330 | $48,750 | $144,580 |
| 2019 | $2,702 | $193,330 | $48,750 | $144,580 |
| 2018 | $2,610 | $183,870 | $48,750 | $135,120 |
| 2017 | $2,540 | $183,870 | $48,750 | $135,120 |
| 2016 | $2,442 | $183,870 | $48,750 | $135,120 |
| 2015 | $2,442 | $183,870 | $48,750 | $135,120 |
| 2014 | $2,480 | $183,870 | $48,750 | $135,120 |
Source: Public Records
Map
Nearby Homes
- 7425 Poyner Rd
- 724 17th Ave
- LOT 9 Bosco Heights Second Addition
- 6511 Gilbertville Rd
- 1908 5th St
- Lot 8 Bosco Heights Second Addition
- Lot 18 Bosco Heights 2nd Addition
- Lot 10 Bosco Heights 2nd Addition
- Lot 20 Bosco Heights 2nd Addition
- Lot 15 Bosco Heights 2nd Addition
- Lot 17 Bosco Heights 2nd Addition
- Lot 12 Bosco Heights 2nd Addition
- Lot 7 Bosco Heights 2nd Addition
- Lot 11 Bosco Heights 2nd Addition
- Lot 2 Bosco Heights 2nd Addition
- Lot 3 Bosco Heights 2nd Addition
- Lot 1 Bosco Heights 2nd Addition
- Lot 4 Bosco Heights 2nd Addition
- 312 Elaine Dr
- 6513 Lafayette Rd