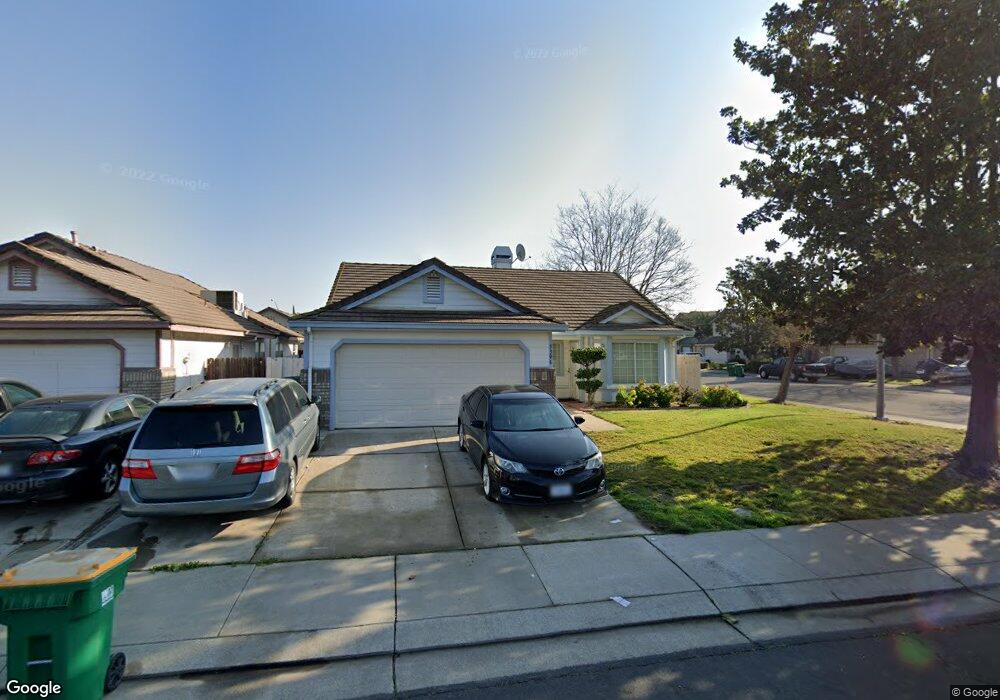
5306 Saint Kitts Ct Stockton, CA 95210
Valley Oak NeighborhoodEstimated Value: $393,000 - $422,000
3
Beds
2
Baths
1,394
Sq Ft
$296/Sq Ft
Est. Value
About This Home
This home is located at 5306 Saint Kitts Ct, Stockton, CA 95210 and is currently estimated at $412,086, approximately $295 per square foot. 5306 Saint Kitts Ct is a home located in San Joaquin County with nearby schools including Rio Calaveras Elementary School, George W. Bush Elementary School, and Valentine Peyton Elementary School.
Ownership History
Date
Name
Owned For
Owner Type
Purchase Details
Closed on
Jul 23, 2021
Sold by
Wu Jingqin
Bought by
Chen De Hui
Current Estimated Value
Home Financials for this Owner
Home Financials are based on the most recent Mortgage that was taken out on this home.
Original Mortgage
$164,500
Outstanding Balance
$149,327
Interest Rate
2.93%
Mortgage Type
New Conventional
Estimated Equity
$262,759
Purchase Details
Closed on
Jul 14, 2021
Sold by
Wong Lily
Bought by
Chen De Hui
Home Financials for this Owner
Home Financials are based on the most recent Mortgage that was taken out on this home.
Original Mortgage
$164,500
Outstanding Balance
$149,327
Interest Rate
2.93%
Mortgage Type
New Conventional
Estimated Equity
$262,759
Purchase Details
Closed on
Aug 22, 2002
Sold by
Biscocho Leoncio M and Biscocho Gemma M
Bought by
Wong Lily
Create a Home Valuation Report for This Property
The Home Valuation Report is an in-depth analysis detailing your home's value as well as a comparison with similar homes in the area
Home Values in the Area
Average Home Value in this Area
Purchase History
| Date | Buyer | Sale Price | Title Company |
|---|---|---|---|
| Chen De Hui | -- | North American Title | |
| Chen De Hui | $235,000 | North American Title | |
| Wong Lily | $196,000 | Fidelity National Title Ins |
Source: Public Records
Mortgage History
| Date | Status | Borrower | Loan Amount |
|---|---|---|---|
| Open | Chen De Hui | $164,500 | |
| Closed | Chen De Hui | $164,500 |
Source: Public Records
Tax History Compared to Growth
Tax History
| Year | Tax Paid | Tax Assessment Tax Assessment Total Assessment is a certain percentage of the fair market value that is determined by local assessors to be the total taxable value of land and additions on the property. | Land | Improvement |
|---|---|---|---|---|
| 2025 | $4,954 | $397,952 | $116,732 | $281,220 |
| 2024 | $4,876 | $390,150 | $114,444 | $275,706 |
| 2023 | $4,768 | $382,500 | $112,200 | $270,300 |
| 2022 | $4,704 | $375,000 | $110,000 | $265,000 |
| 2021 | $3,247 | $262,238 | $77,599 | $184,639 |
| 2020 | $3,310 | $259,550 | $76,804 | $182,746 |
| 2019 | $3,297 | $254,462 | $75,299 | $179,163 |
| 2018 | $3,237 | $249,473 | $73,823 | $175,650 |
| 2017 | $2,951 | $235,000 | $70,000 | $165,000 |
| 2016 | $2,695 | $206,000 | $61,000 | $145,000 |
| 2014 | $2,041 | $157,000 | $47,000 | $110,000 |
Source: Public Records
Map
Nearby Homes
- 5271 Barbados Cir
- 1608 Bonaire Cir
- 4720 Greensboro Way
- 5816 Caribbean Cir
- 5622 Jeffrey Ct
- 5831 Caribbean Cir
- 1750 Bonaire Cir
- 4705 Cayman Ct
- 1122 Morning Dew Place
- 5511 Audrey Dr
- 4718 Hillsboro Way
- 5536 Kermit Ln
- 5431 Strawberry Way
- 4621 Hillsboro Way
- 5662 Kermit Ln
- 5416 Ridgeway Ave
- 2442 Brandywine Ct
- 806 E Longview Ave
- 510 E Bianchi Rd Unit 2
- 2321 Bartram Run Way
- 5314 Saint Kitts Ct
- 5305 Saint Barts Ct
- 5322 Saint Kitts Ct
- 5313 Saint Barts Ct
- 5269 Barbados Cir
- 5267 Barbados Cir
- 5321 Saint Barts Ct
- 5307 Saint Kitts Ct
- 5315 Saint Kitts Ct
- 5330 Saint Kitts Ct
- 5265 Barbados Cir
- 5273 Barbados Cir
- 5323 Saint Kitts Ct
- 5329 Saint Barts Ct
- 5263 Barbados Cir
- 5275 Barbados Cir
- 5338 Saint Kitts Ct
- 5331 Saint Kitts Ct
- 5337 Saint Barts Ct
- 5261 Barbados Cir