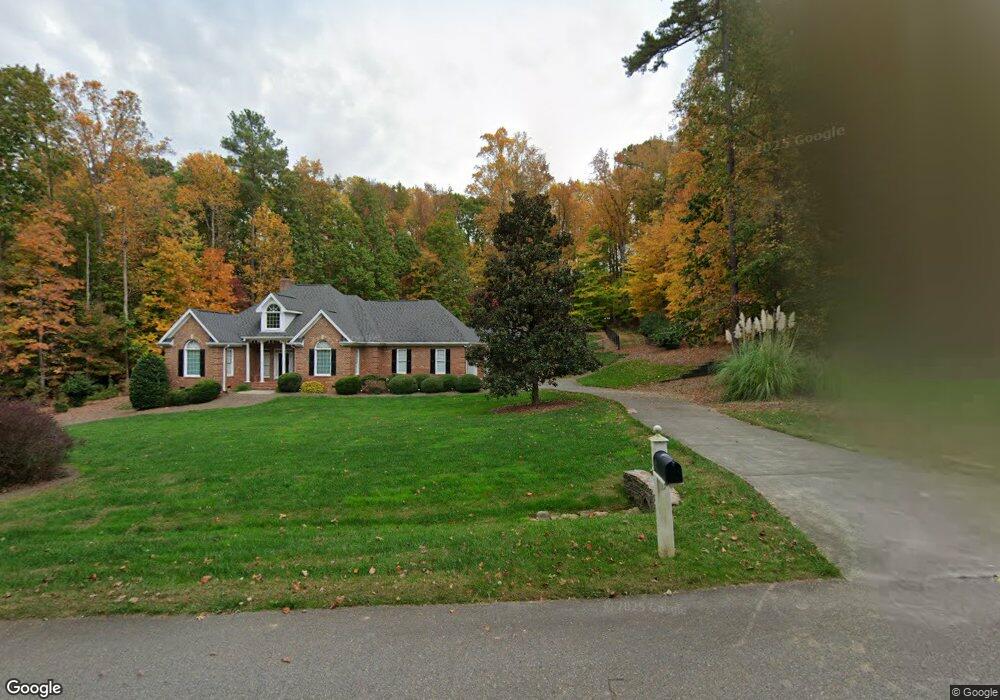
5306 Strathmore Dr Raleigh, NC 27613
Eastern Durham NeighborhoodEstimated Value: $805,000 - $998,000
4
Beds
4
Baths
2,773
Sq Ft
$315/Sq Ft
Est. Value
About This Home
This home is located at 5306 Strathmore Dr, Raleigh, NC 27613 and is currently estimated at $874,185, approximately $315 per square foot. 5306 Strathmore Dr is a home located in Durham County with nearby schools including Spring Valley Elementary School, John W Neal Middle School, and Southern School of Energy & Sustainability.
Ownership History
Date
Name
Owned For
Owner Type
Purchase Details
Closed on
Sep 15, 2016
Sold by
Myers Craig J
Bought by
Ratcliffe Erika L and Schwartz Martha M
Current Estimated Value
Home Financials for this Owner
Home Financials are based on the most recent Mortgage that was taken out on this home.
Original Mortgage
$414,000
Outstanding Balance
$330,687
Interest Rate
3.43%
Mortgage Type
New Conventional
Estimated Equity
$543,498
Purchase Details
Closed on
Sep 9, 1999
Sold by
Sharpe Home Concepts Inc
Bought by
Myers Craig J and Myers Melissa K
Home Financials for this Owner
Home Financials are based on the most recent Mortgage that was taken out on this home.
Original Mortgage
$246,400
Interest Rate
6.75%
Purchase Details
Closed on
Feb 5, 1999
Sold by
Hunter Betty W
Bought by
Sharpe Home Concepts Inc
Home Financials for this Owner
Home Financials are based on the most recent Mortgage that was taken out on this home.
Original Mortgage
$35,625
Interest Rate
6.8%
Create a Home Valuation Report for This Property
The Home Valuation Report is an in-depth analysis detailing your home's value as well as a comparison with similar homes in the area
Home Values in the Area
Average Home Value in this Area
Purchase History
| Date | Buyer | Sale Price | Title Company |
|---|---|---|---|
| Ratcliffe Erika L | $460,000 | -- | |
| Myers Craig J | $308,000 | -- | |
| Sharpe Home Concepts Inc | $47,500 | -- |
Source: Public Records
Mortgage History
| Date | Status | Borrower | Loan Amount |
|---|---|---|---|
| Open | Ratcliffe Erika L | $414,000 | |
| Previous Owner | Myers Craig J | $246,400 | |
| Previous Owner | Sharpe Home Concepts Inc | $35,625 | |
| Closed | Myers Craig J | $30,800 |
Source: Public Records
Tax History Compared to Growth
Tax History
| Year | Tax Paid | Tax Assessment Tax Assessment Total Assessment is a certain percentage of the fair market value that is determined by local assessors to be the total taxable value of land and additions on the property. | Land | Improvement |
|---|---|---|---|---|
| 2025 | $5,486 | $792,858 | $222,600 | $570,258 |
| 2024 | $4,980 | $502,131 | $153,937 | $348,194 |
| 2023 | $4,690 | $502,131 | $153,937 | $348,194 |
| 2022 | $4,503 | $502,131 | $153,937 | $348,194 |
| 2021 | $4,242 | $502,131 | $153,937 | $348,194 |
| 2020 | $4,191 | $502,131 | $153,937 | $348,194 |
| 2019 | $4,191 | $502,131 | $153,937 | $348,194 |
| 2018 | $4,113 | $450,882 | $84,910 | $365,972 |
| 2017 | $4,068 | $450,882 | $84,910 | $365,972 |
| 2016 | $3,944 | $450,882 | $84,910 | $365,972 |
| 2015 | $4,351 | $452,079 | $93,000 | $359,079 |
| 2014 | -- | $452,079 | $93,000 | $359,079 |
Source: Public Records
Map
Nearby Homes
- 5509 Strathmore Dr
- 1102 Stanridge Dr
- 5008 Tallwood Dr
- 1804 Carpenter Pond Rd
- 3508 Thornwood Ct
- 6825 Mactavish Way
- 12216 Kyle Abbey Ln
- 11636 Appaloosa Run W
- 11637 Appaloosa Run W
- 1804 Okeefe Ln
- 6917 Fiddleman Way
- 1800 Okeefe
- 7690 Wake Forest Hwy
- 2506 Coley Rd
- 12660 Boyce Mill Rd
- 11912 Straight A Way Ln
- 2612 Scarlet Sage Ct
- 8510 Dunlee Falls Rd
- 7001 Rosewood Park Ct
- 6103 Old Kemp Rd
- 5316 Strathmore Dr
- 5208 Strathmore Dr
- 5509 Strathmore Dr Unit 13
- 6 King William Ct
- 5204 Strathmore Dr
- 5 King William Ct
- 5317 Strathmore Dr
- 1205 Stanridge Dr
- 4 Highcross Ct
- 1210 Stanridge Dr
- 5205 Strathmore Dr
- 5405 Strathmore Dr
- 1206 Stanridge Dr
- 2 Highcross Ct
- lot 31 Stanhope Dr
- lot 30 Stanhope Dr
- Lot 18 Stanhope Dr
- Lot 28 Stanhope Dr
- lot 27 Stanhope Dr
- Lot 20 Stanhope Dr